
|
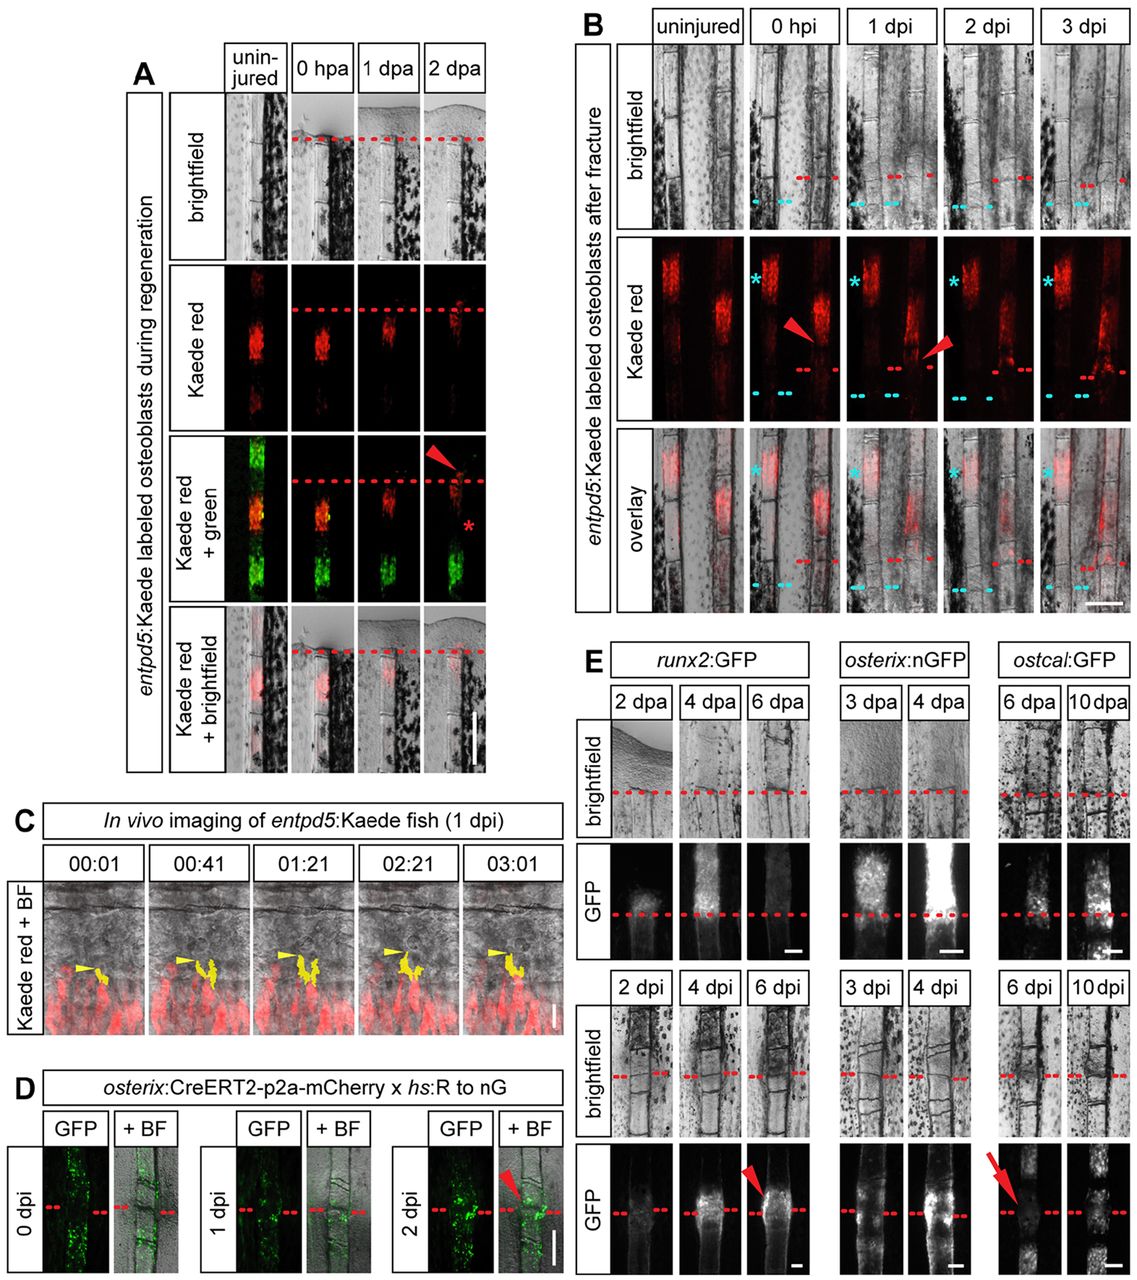
Fig. 3 Dedifferentiated osteoblasts migrate toward the injury site, where they redifferentiate. (A) entpd5:Kaede is expressed in mature osteoblasts in the center of the bony fin ray segments. In response to fin amputation, photoconverted osteoblasts (red) migrate to and beyond the amputation plane (arrowhead), as seen by repeated imaging of the same fish. At the same time the gap devoid of labeled osteoblasts at the segment boundary widens (asterisk). (B) Photoconverted osteoblasts in entpd5:Kaede transgenic fish in a segment adjacent to a fracture (right fin ray, arrowhead) or in the second segment from the fracture (left ray, asterisk). Osteoblasts migrate toward the fracture only from the segment adjacent to it. (C) Still images from a confocal time-lapse movie of migrating photoconverted Kaede+ osteoblasts in close proximity to the fracture. Protrusions of one cell are highlighted in yellow, its leading edge with an arrowhead. (D) osterix+ cells or their progeny accumulate at the fracture at 2dpi (arrowhead), as revealed by stochastic Cre-mediated genetic labeling of osteoblasts in osterix:CreERT2-p2a-mCherry×hs:R to nG fish. (E) Comparison of transgene expression in runx2:GFP, osterix:nGFP and osteocalcin:GFP fins during regeneration after amputation (upper panels) versus repair after fracture (lower panels). ostcal, osteocalcin. Scale bars: 200µm in A,B,D; 20µm in C; 100µm in E.