
- Title
-
Knockdown of Bardet-Biedl Syndrome Gene BBS9/PTHB1 Leads to Cilia Defects
- Authors
- Veleri, S., Bishop, K., Dalle Nogare, D.E., English, M.A., Foskett, T.J., Chitnis, A., Sood, R., Liu, P., and Swaroop, A.
- Source
- Full text @ PLoS One
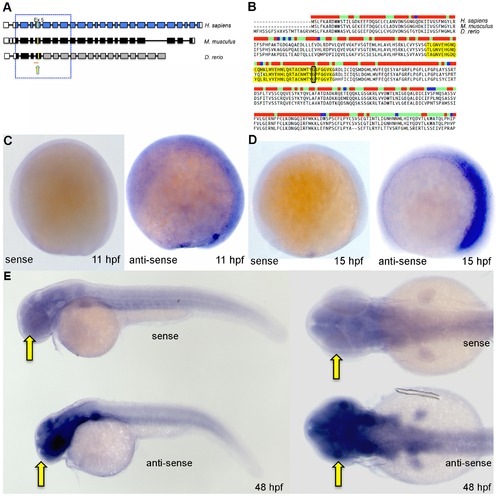
Zebrafish bbs9 gene: structural comparison and expression pattern. (A) A comparison of BBS9 exon:intron structure between human (H. sapiens, top blue), mouse (M. musculus, middle black) and zebrafish (D. rerio, bottom gray/black). The filled and open boxes indicate coding exons and UTRs, respectively. The blue and black boxes represent validated exons. The gray boxes represent exons present in provisional sequence XM_002664792.1. Exons 2 to 8 are highly conserved across species (boxed area within hatched square). The yellow arrow points to yellow mark on exon 5, which represents the missense mutation G′A (p.G141R) in human BBS9 protein. Under the zebrafish bbs9 transcript, the red line represents bbs9-spMO targeting site at intron4:exon5 boundary. (B) The protein sequence alignment (clustalW) between human (NP_940820.1), mouse (NP_848502.1) and predicted zebrafish BBS9 (904 amino acids). Exon 5 is highlighted (yellow), and the position of missense mutation (p.G141R) in human is highlighted by a black rectangle. The bar coding on top of the sequences represents degree of conservation (red and blue represent maximum and minimum conservation, respectively). (C, D) In situ hybridization analysis at 11 hpf and 15 hpf. Left and right panels represent the sense and anti-sense probes generated from bbs9 cDNA. (E) In situ hybridization analysis at 48 hpf. Expression of bbs9 in the eye, brain and somites gives a strong signal with the anti-sense probe compared to the background signal from the sense probe. Compare the strong signal in the head regions (arrows). Left and right panels represent lateral and dorsal views, respectively. EXPRESSION / LABELING:
|
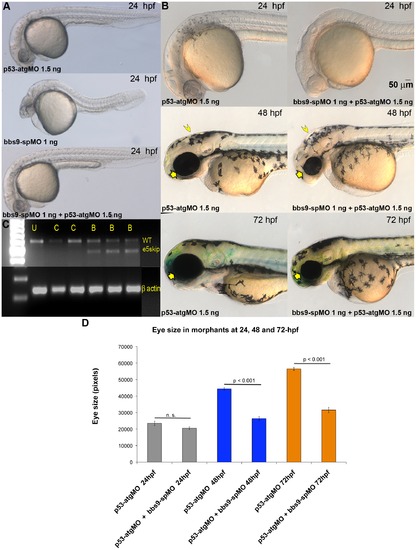
Exon 5-targeted bbs9 splice morpholino affects eye development independent of p53 pathway. (A) At 24 hpf, the p53-atgMO (1.5 ng) alone injection did not elicit a phenotype. The bbs9-spMO (1 ng) injection alone caused developmental defects in the eye, brain and tail of morphants. However, co-injection of p53-atgMO reduced the defects seen by the bbs9-spMO injection alone, though mild eye defect remained the tail becomes normal (bottom panel). (B) Higher magnification of morphants′ head region. Top, middle and bottom rows are 24-, 48- and 72-hpf, respectively. Left and right column of panels are p53-atgMO without and with bbs9-spMO, respectively. At 48 hpf the effect of bbs9-spMO injection on eye size visible (compare the arrows). The bbs9-spMO injection also resulted in hydrocephalous (compare the arrow heads). The defects seen at 48 hpf are weaker at 72 hpf. (C) The gel photograph of RT-PCR showing exon-skipping by bbs9-spMO. mRNA isolated from individual embryos was used for RT-PCR. U, C (4 and 6 ng) and B (1, 4, 6 ng) represent un-injected, control, and bbs9-spMO, respectively. Splice blocking gave an additional smaller (marked e5skip) band along with the original WT band. The bottom panel shows β-actin control for respective samples. (D) Quantification of the effect of morpholino(s) injection on eye size. X-axis shows the morpholinos used and time (hpf) of scoring. Y-axis shows eye size in pixels (mean ± SEM). PHENOTYPE:
|
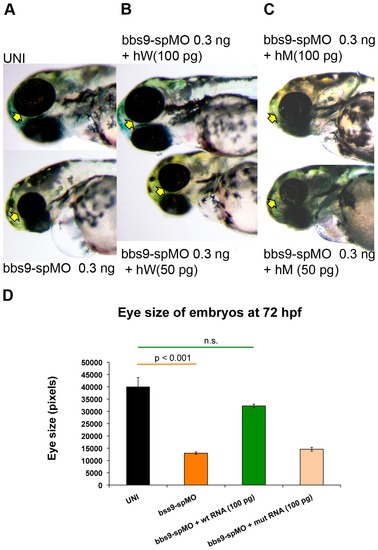
Human mRNA rescues zebrafish bbs9-spMO phenotype. hW and hM represent wild type and mutant human mRNA, respectively. The arrows indicate eye phenotype. (A) The uninjected control (top) and bbs9-spMO alone injected (bottom) zebrafish at 72 hpf. (B) Rescue of bbs9-spMO eye phenotype by hW 100 pg (top), but not by lower dose of 50 pg (bottom). (C) The bbs9-spMO phenotype is not rescued by hM as the eye defect remains in the morphants. (D) The quantification of embryos′ eye size at 72 hpf in rescue experiment using human mRNAs co-injected with bbs9-spMO. X-axis shows category of embryos scored. Y-axis shows the eye size in pixels. Data are presented as mean ± SEM. Statistically significant and non-significant observations are indicated with p value and n.s., respectively. |
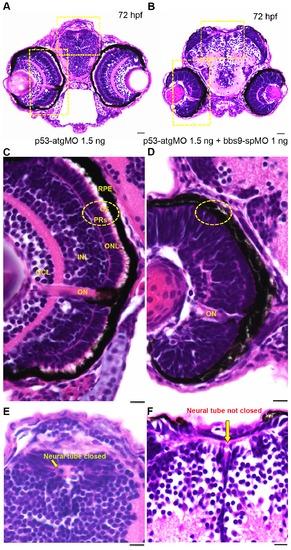
bbs9-spMO morphant shows defects in retina lamination and neural tube closure. Zebrafish head sections (72 hfp) stained with H& E. (A) The morphant injected with p53-atgMO (1.5 ng) shows normal retinal lamination and neural tube (areas highlighted with hatched yellow rectangles). (B) The morphant co-injected with bbs9-spMO (1 ng) and p53-atgMO (1.5 ng) shows lack of retinal lamination and incomplete closure of neural tube (areas highlighted with hatched yellow rectangles). (C) The morphant retina in higher magnification - area boxed in ‘A’. The retina shows all the 5 layers: Retinal pigment epithelium (RPE) abutting close to photoreceptors (PRs). The PRs (hatched circle) have visible outer segments (OS). Next to PRs are the outer nuclear layer (ONL) followed by an intact inner nuclear layer (INL) and the ganglion cell layer (GCL). The optical nerve (ON) is used as a reference point. (D) The bbs9-spMO injected morphant retina in higher magnification - area boxed in ‘B’. The retina shows no clear lamination and it lacks photoreceptor outer segments (hatched circle). (E) The morphant neural tube in higher magnification from ‘A’ shows normal closure (arrow). (F) The bbs9-spMO injected morphant neural tube in higher magnification from ‘B’ shows incomplete closure of neural tube (arrow). The scale bars indicate 100 μm. PHENOTYPE:
|
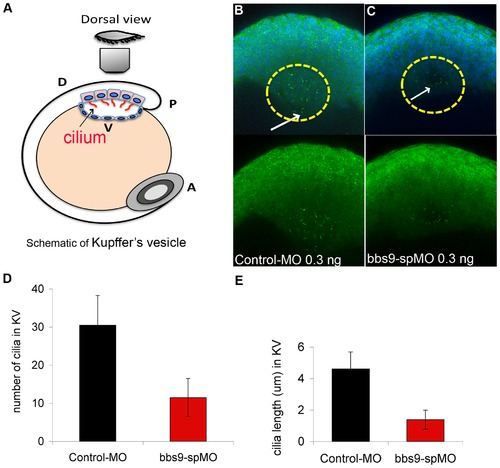
Knockdown of bbs9 affects cilia in Kupffer′s vesicle. (A) Schematic view of Kupffer′s vesicle (KV) in zebrafish embryo at 12 hpf. A, P, D and V indicate anterior, posterior, dorsal and ventral sides, respectively. (B) Morphant injected with control-MO (0.3 ng). (C) Morphant injected with bbs9-spMO (0.3 ng). In the morphants, KV cilia were visualized by staining with both anti-α-tubulin and anti-γ-tubulin (green), between 10–13 hpf. In ‘B’, cilia are more in number and are longer (cf. white arrows) than in ‘C’. In B and C, upper panels show the nuclei visualized with DAPI. (D) and (E) show quantification of KV cilia number and length, respectively. The Y-axis represents the mean ± SEM. The X-axis represents the indicated category of morphants analyzed. PHENOTYPE:
|
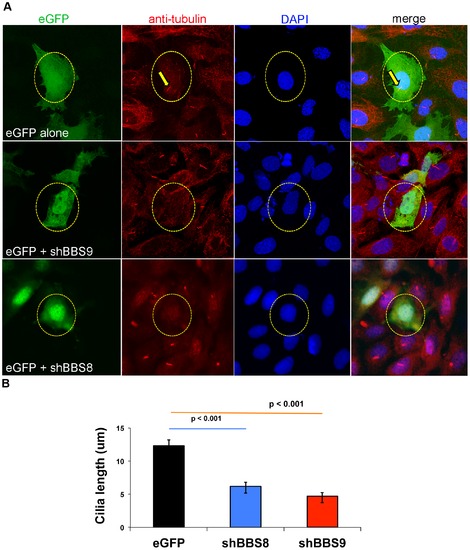
Knockdown of Bbs9 affects ciliogenesis in IMCD3 cells. (A) Bbs8 and Bbs9 shRNA transfection in IMCD3 cells. The top row shows eGFP control transfection, whereas middle and bottom rows represent eGFP co-transfected with shRNA against Bbs9 or Bbs8, respectively. The nuclei are visualized with DAPI (blue). Transfection is visualized with eGFP (green). Cilia are visualized with both anti-alpha-tubulin and gamma-tubulin (red). shRNA transfected cells (green) have no cilia (red) - highlighted with yellow circle (broken). In the top control panel, eGFP alone-transfected cell shows a cilium (highlighted with yellow arrows). Images are taken at 60× magnification. (B) The quantification of cilia length after Bbs8 and Bbs9 shRNA transfection in IMCD3 cells (obtained from A). The X and Y axes respectively show transfection category and length (micrometer) of cilia in eGFP transfected cells per seven fields. Data are presented as mean ± SEM, and statistical significance is indicated with p values. |

Unillustrated author statements PHENOTYPE:
|