
|
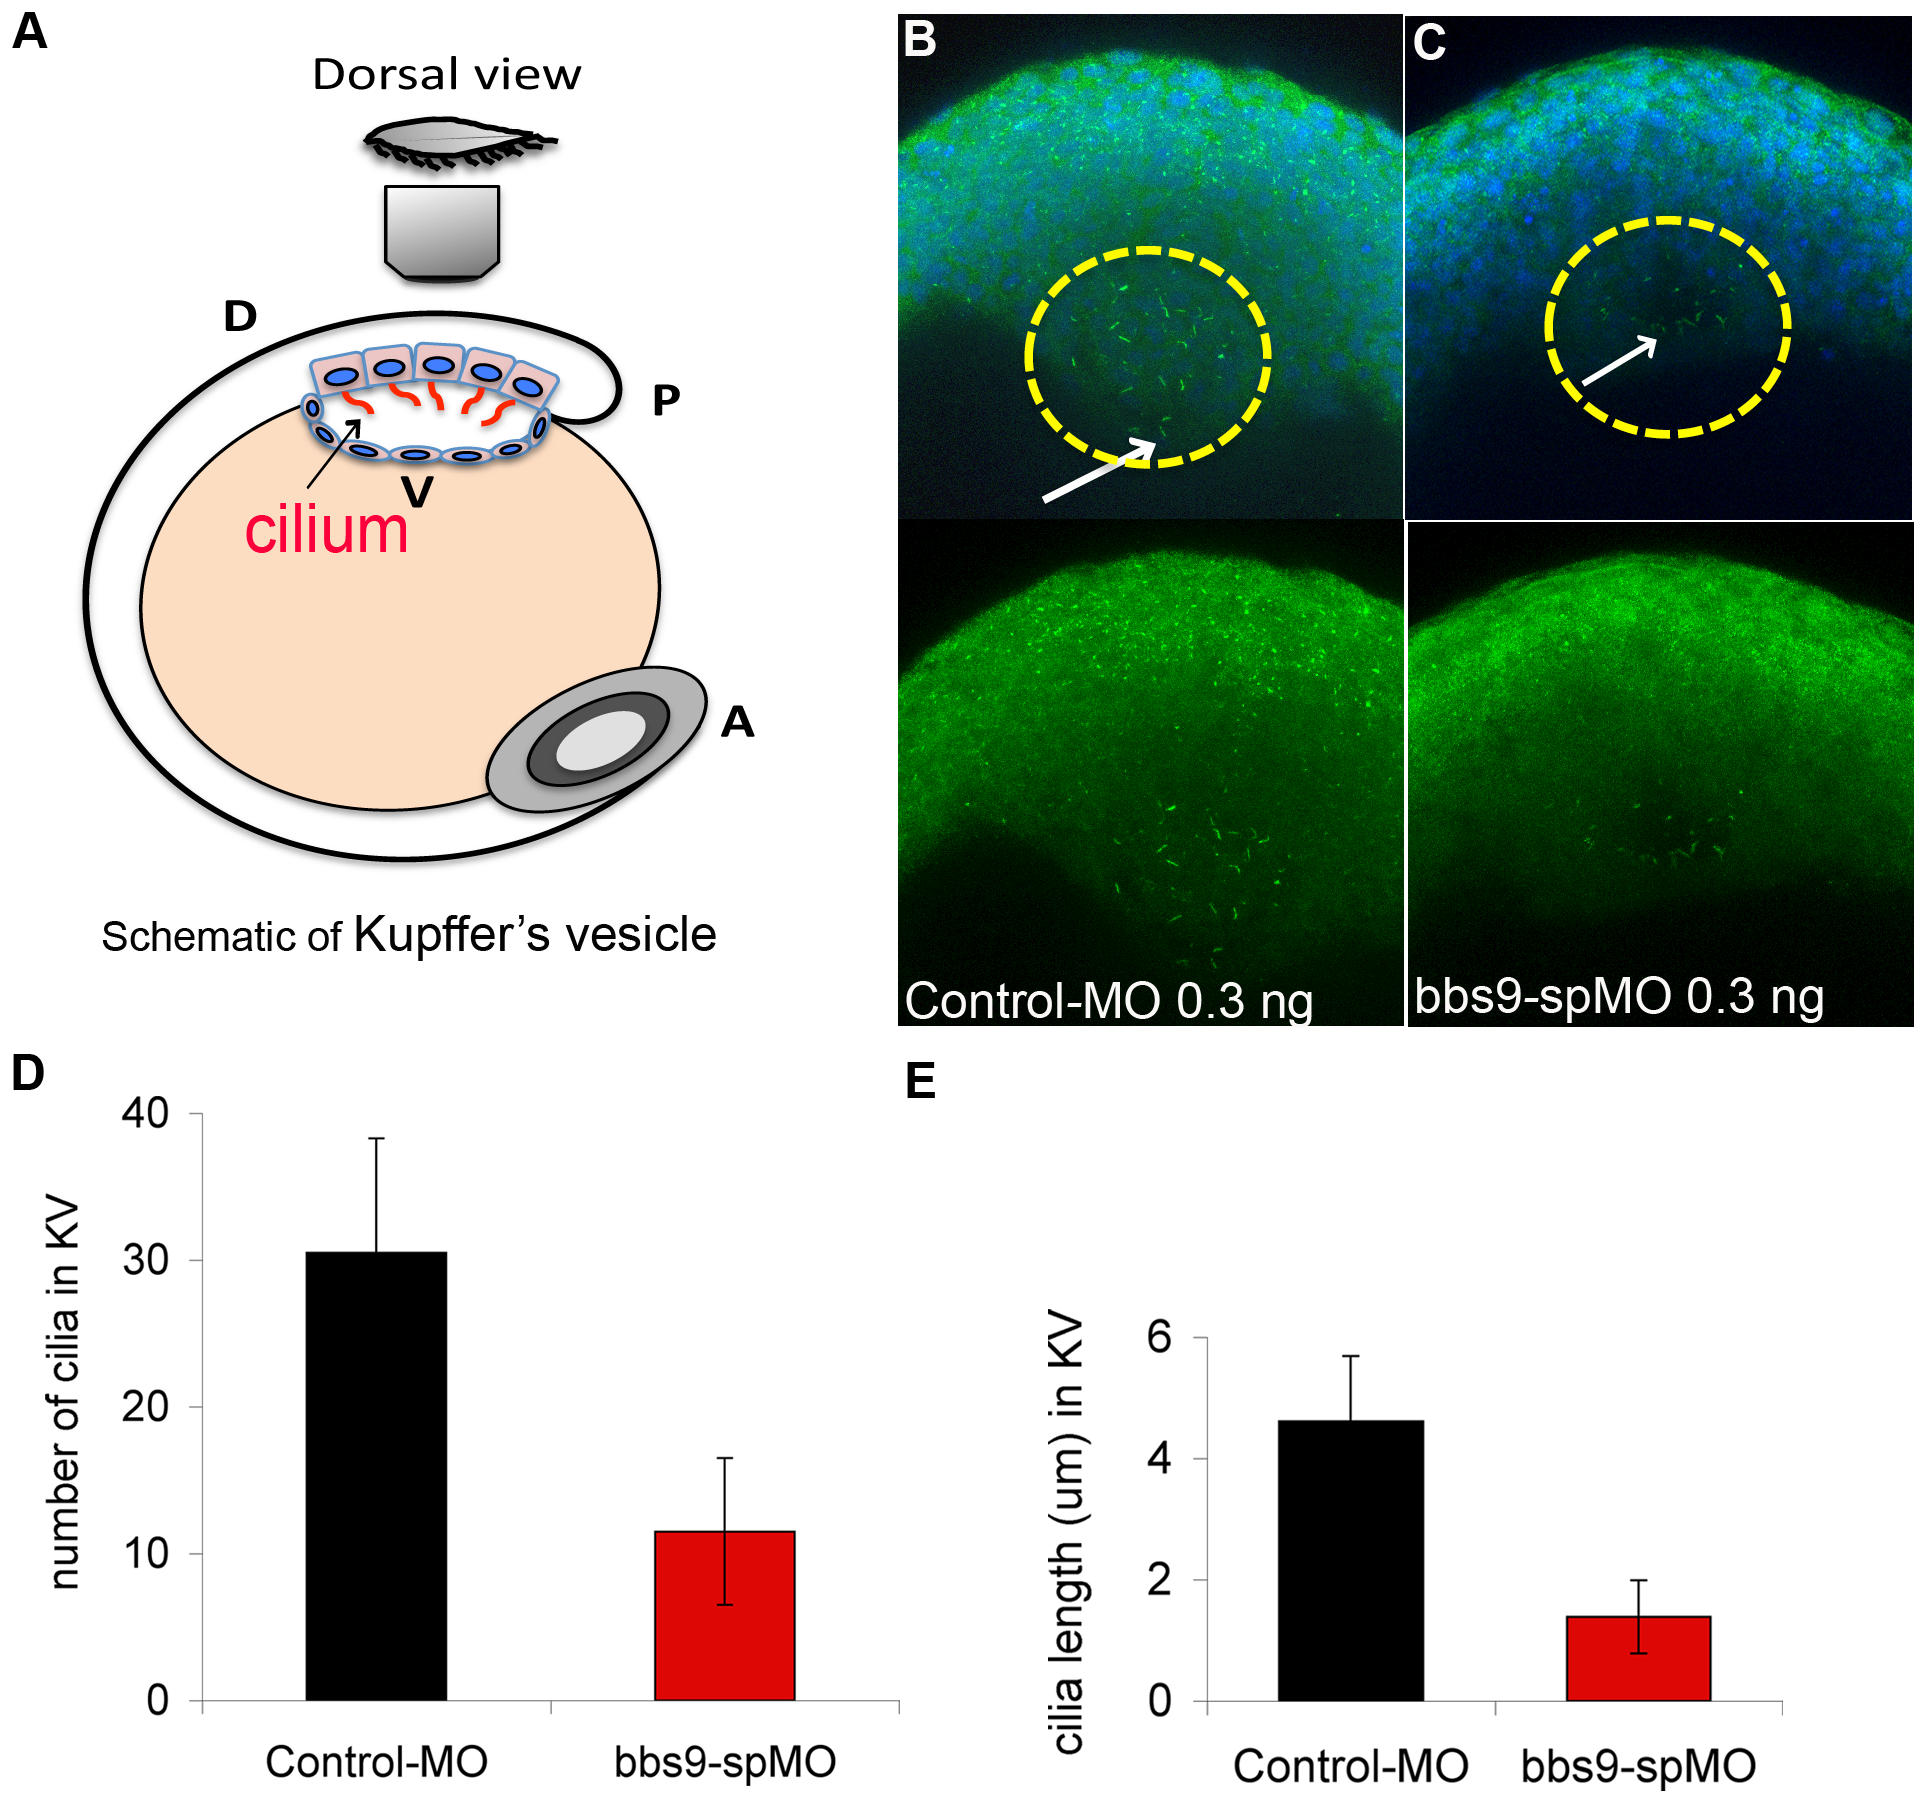
Fig. 5
Knockdown of bbs9 affects cilia in Kupffer′s vesicle.
(A) Schematic view of Kupffer′s vesicle (KV) in zebrafish embryo at 12 hpf. A, P, D and V indicate anterior, posterior, dorsal and ventral sides, respectively. (B) Morphant injected with control-MO (0.3 ng). (C) Morphant injected with bbs9-spMO (0.3 ng). In the morphants, KV cilia were visualized by staining with both anti-α-tubulin and anti-γ-tubulin (green), between 10–13 hpf. In ‘B’, cilia are more in number and are longer (cf. white arrows) than in ‘C’. In B and C, upper panels show the nuclei visualized with DAPI. (D) and (E) show quantification of KV cilia number and length, respectively. The Y-axis represents the mean ± SEM. The X-axis represents the indicated category of morphants analyzed.