
|
Fig. 6
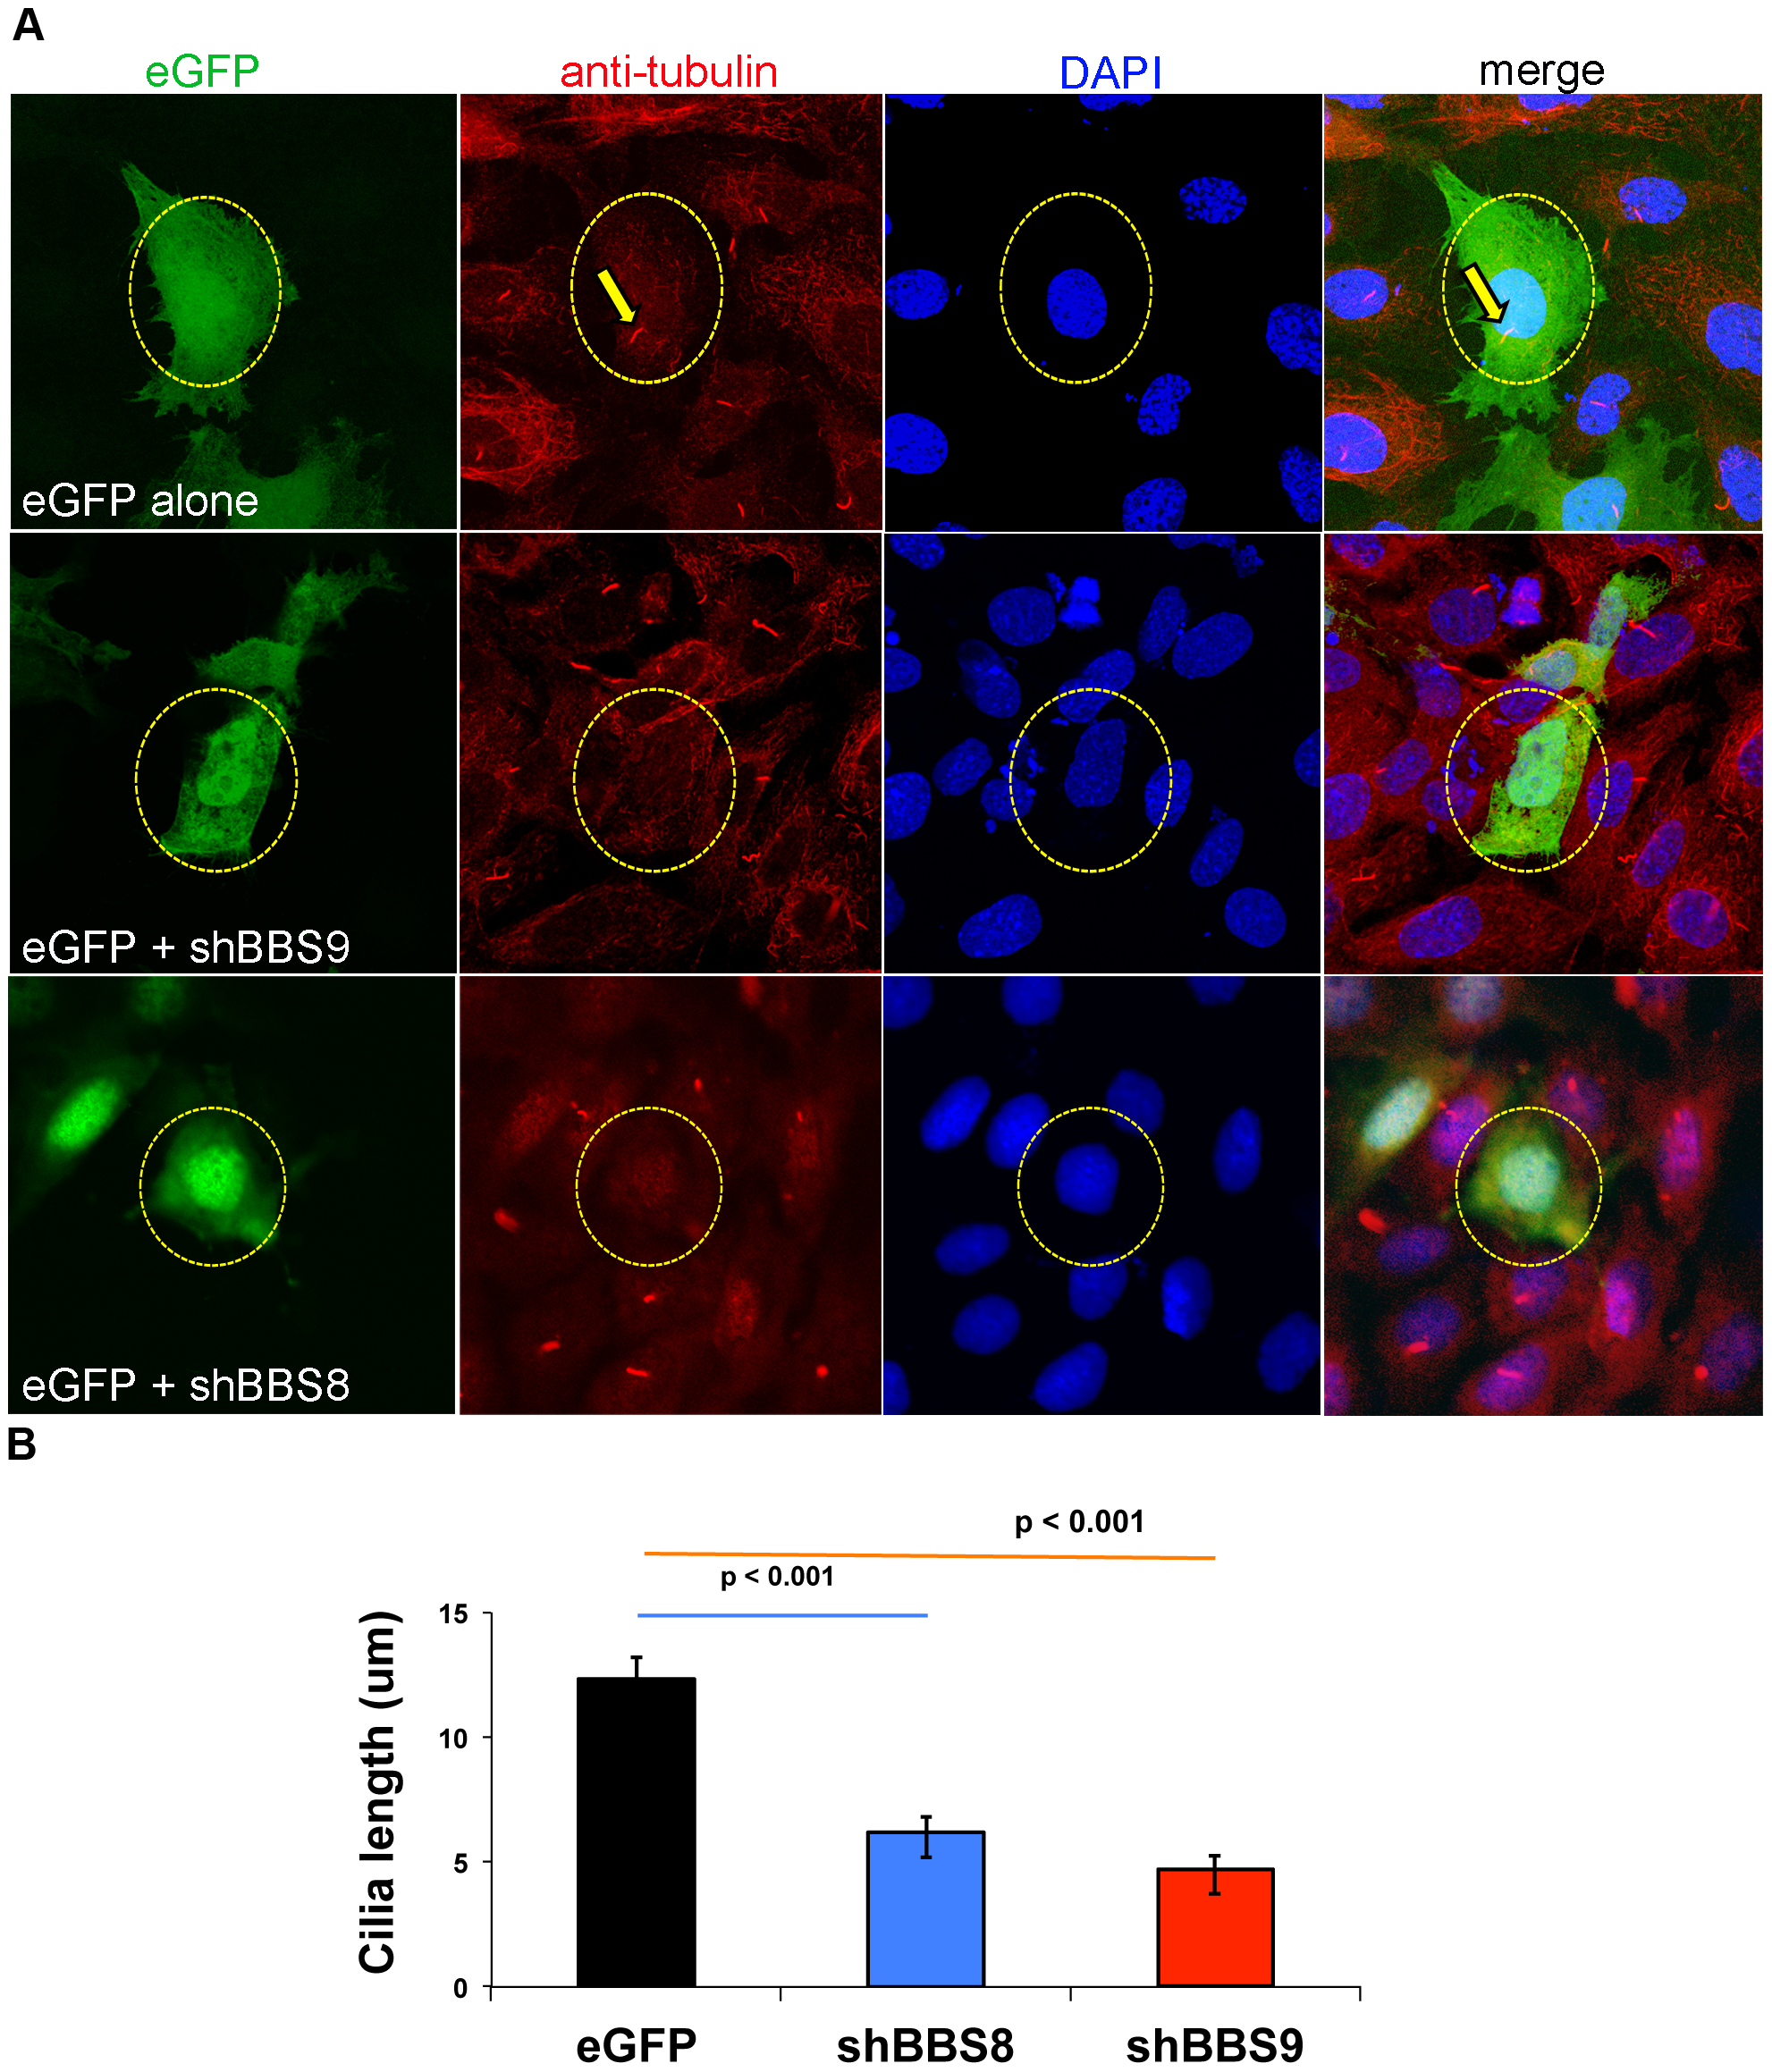
Knockdown of Bbs9 affects ciliogenesis in IMCD3 cells.
(A) Bbs8 and Bbs9 shRNA transfection in IMCD3 cells. The top row shows eGFP control transfection, whereas middle and bottom rows represent eGFP co-transfected with shRNA against Bbs9 or Bbs8, respectively. The nuclei are visualized with DAPI (blue). Transfection is visualized with eGFP (green). Cilia are visualized with both anti-alpha-tubulin and gamma-tubulin (red). shRNA transfected cells (green) have no cilia (red) - highlighted with yellow circle (broken). In the top control panel, eGFP alone-transfected cell shows a cilium (highlighted with yellow arrows). Images are taken at 60× magnification. (B) The quantification of cilia length after Bbs8 and Bbs9 shRNA transfection in IMCD3 cells (obtained from A). The X and Y axes respectively show transfection category and length (micrometer) of cilia in eGFP transfected cells per seven fields. Data are presented as mean ± SEM, and statistical significance is indicated with p values.