
|
Fig. 1
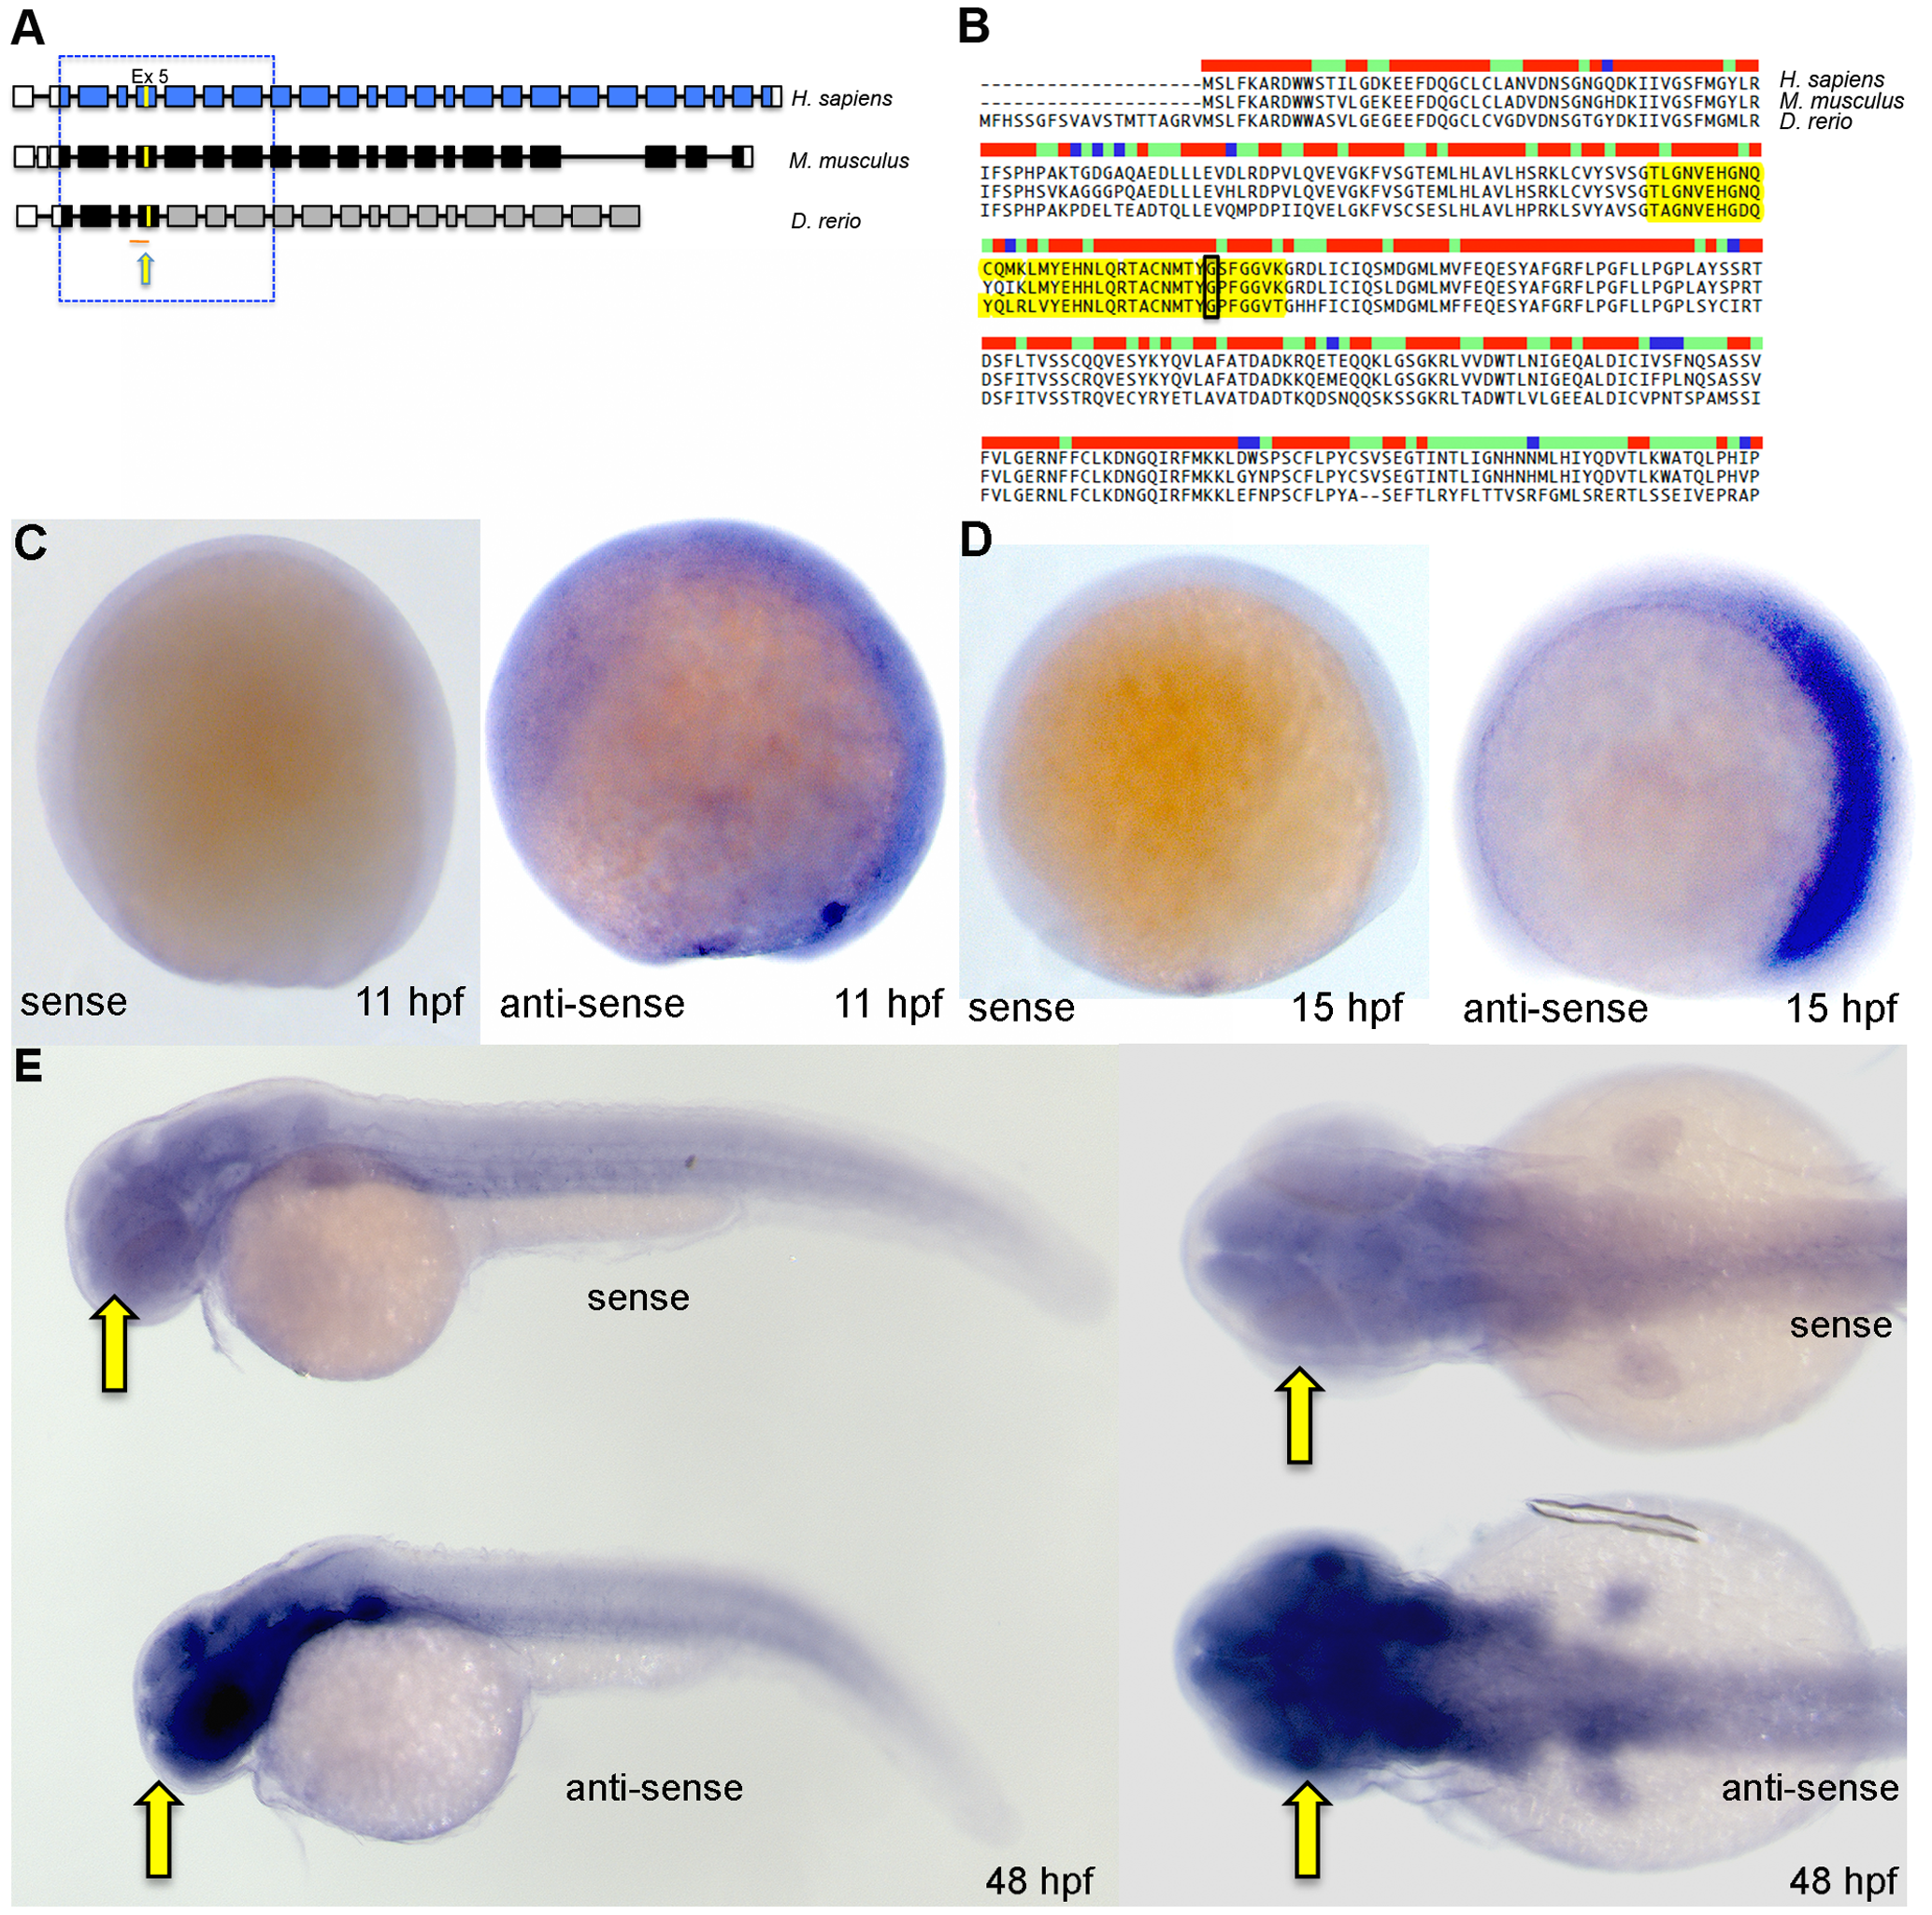
Zebrafish bbs9 gene: structural comparison and expression pattern.
(A) A comparison of BBS9 exon:intron structure between human (H. sapiens, top blue), mouse (M. musculus, middle black) and zebrafish (D. rerio, bottom gray/black). The filled and open boxes indicate coding exons and UTRs, respectively. The blue and black boxes represent validated exons. The gray boxes represent exons present in provisional sequence XM_002664792.1. Exons 2 to 8 are highly conserved across species (boxed area within hatched square). The yellow arrow points to yellow mark on exon 5, which represents the missense mutation G′A (p.G141R) in human BBS9 protein. Under the zebrafish bbs9 transcript, the red line represents bbs9-spMO targeting site at intron4:exon5 boundary. (B) The protein sequence alignment (clustalW) between human (NP_940820.1), mouse (NP_848502.1) and predicted zebrafish BBS9 (904 amino acids). Exon 5 is highlighted (yellow), and the position of missense mutation (p.G141R) in human is highlighted by a black rectangle. The bar coding on top of the sequences represents degree of conservation (red and blue represent maximum and minimum conservation, respectively). (C, D) In situ hybridization analysis at 11 hpf and 15 hpf. Left and right panels represent the sense and anti-sense probes generated from bbs9 cDNA. (E) In situ hybridization analysis at 48 hpf. Expression of bbs9 in the eye, brain and somites gives a strong signal with the anti-sense probe compared to the background signal from the sense probe. Compare the strong signal in the head regions (arrows). Left and right panels represent lateral and dorsal views, respectively.