- Title
-
Integrin-α5 Coordinates Assembly of Posterior Cranial Placodes in Zebrafish and Enhances Fgf-Dependent Regulation of Otic/Epibranchial Cells
- Authors
- Bhat, N., and Riley, B.B.
- Source
- Full text @ PLoS One
|
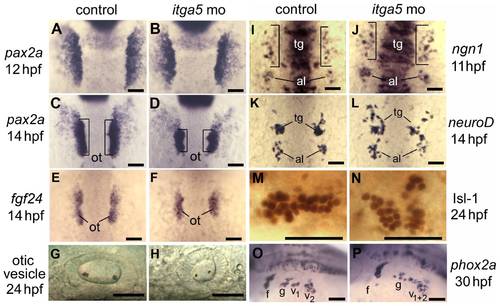
Knockdown of itga5 impairs morphogenesis of posterior cranial placodes. (A–D) pax2a expression at 12 and 14 hpf in the otic/epibranchial domain in control embryos (A, C) and itga5 morphants (B, D). Expression is normal at 12 hpf in itga5 morphants but the otic placode (o, brackets) is smaller than normal by 14 hpf. (E, F) fgf24 expression at 14 hpf in a control embryo (E) and itga5 morphant (F). (G, H) Otic vesicles at 24hpf in a control embryo (G) and itga5 morphant (H). (I, J) ngn1 expression at 11 hpf in a control embryo (I) and itga5 morphant (J). (K, L) neuroD expression at 14 hpf in a control embryo (K) and itga5 morphant (L). Precursors of the trigeminal ganglion (tg) and anterior lateral line (al) are indicated. (M, N) Anti-Isl-1 immunostaining at 24 hpf in a control embryo (M) and itga5 morphant (N). (O, P) phox2a expression in epibranchial ganglia at 30 hpf in a control embryo (O) and itga5 morphant (P). Facial (f), glossopharyngeal (g), and vagal ganglia (v1+v2) are indicated. A–E, I–K are dorsal views with anterior to the top; G, H, M–P are lateral views with anterior to the left. Scale bar, 50 μm. |
|
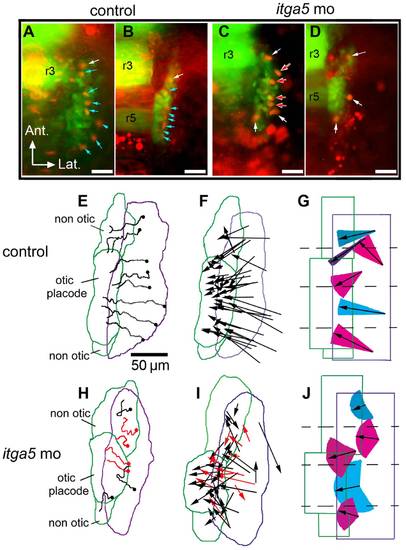
Otic/epibranchial precursors show aberrant migration in itga5 morphants. (A–D) Images from time-lapse movies showing transgenic expression of pax2a:GFP (green) and mosaic expression of cmv:RFP (red). The first frame (11.5 hpf) and final frame (14.5 hpf) of a control movie (A, B) and itga5 morphant movie (C, D) are shown. Arrows indicate cells that expressed both GFP and RFP. Blue arrows indicate cells that contributed to the otic domain, and white arrows indicate cells that contributed to non-otic domains. Red arrows indicate cells that lysed during the recording period (C, D). Positions of rhombomeres 3 and 5 (r3, r5) are indicated. (E, H) Maps showing the trajectories of all marked cells in the embryos recorded in A–D. Trajectories in red denote cells that lysed during recording (H). The origins of cell trajectories are marked with dots. The initial and final positions of the pax2a:GFP domain are indicated by purple and green boundaries, respectively. Final positions of the otic placode and non-otic domains are indicated. (F, I) Vector maps showing net displacement of all cells tracked in 5 control movies (F) and 4 itga5 morphant movies (I). Red arrows indicate cells that died during recording (I). (G, J) Summaries of average migration patterns of cells in different quadrants of the pax2a:GFP domain in control embryos (G) and itga5 morphants (J). Arrow length indicates the mean of the net displacement of cells in the indicated region, and colored cones represent the range of angle of net displacement. Quadrants 1 and 2 contained cells contributing to both otic and non-otic domains, which were grouped separately. All images depict the right half of the embryo with lateral to the right and anterior to the top. Scale bar, 50 μm. |
|
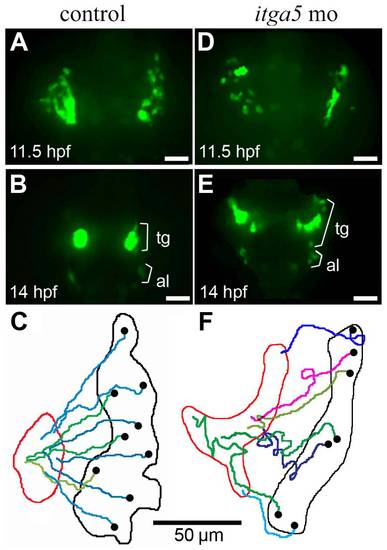
Convergence of trigeminal precursors is impaired in itga5 morphants. (A, B, D, E) Images of time-lapse movies showing transgenic neuroD:EGFP expression in the first (11.5 hpf) and final (14 hpf) frames of a control movie (A, B) and itga5 morphant movie (D, E). Positions of precursors of the trigeminal ganglion (tg) and anterior lateral line (al) are indicated. (C, F) Maps showing the trajectories of individual trigeminal precursors in the control embryo (C) and itga5 morphant (F). Black and red boundaries mark the initial and final distribution, respectively, of neuroD:EGFP-positive trigeminal precursors. Black dots represent the initial and final positions, respectively, of individual cells. Images show dorsal views with anterior to the top, and summary figures show the right trigeminal field of each embryo, with lateral to the right. Scale bar, 50 μm. |
|
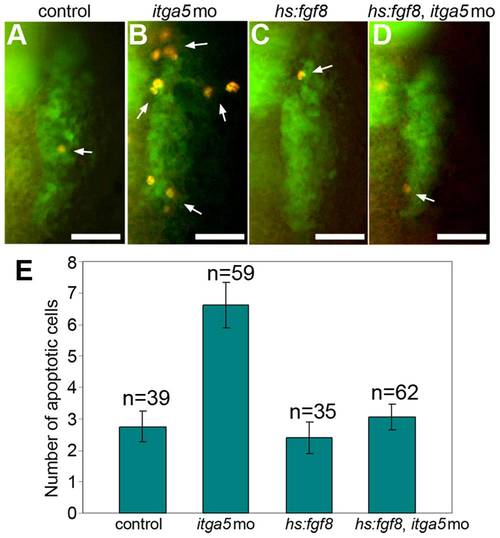
Elevated cell death in itga5 morphants is rescued by hs:fgf8. <>(A–D) Transgenic pax2a:GFP embryos immunostained for GFP (green) and Caspase3 (red). Images show dorsal views (anterior up) of the right otic/epibranchial domain in a control embryo (A), itga5 morphant (B), hs:fgf8/+ embryo (C) and hs:fgf8/+ embryo injected with itga5-MO (D). White arrows mark apoptotic cells. All embryos were heat shocked at 39°C for 30 minutes beginning at 11.5hpf and fixed at 13.5 hpf. Scale bar, 50 μm. (E) Mean number of Caspase3-positive cells in the otic/epibranchial domain in each of the four groups of embryos. Error bars indicate S.E.M. |
|
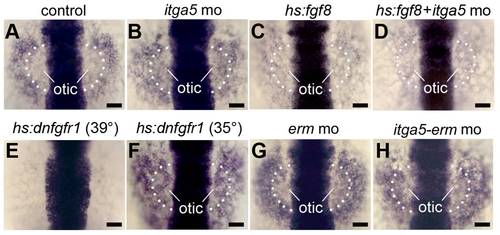
Similar effects of Itga5 and Fgf on sox3 expression. (A–H) sox3 expression at 12.5 hpf in a control embryo (A), itga5 morphant (B), Tg(hs:fgf8/+) heat shocked at 37°C alone (C) or with itga5 morpholino (D), Tg(hs:dnfgfr1/+) heat shocked at 39°C (E) or 35°C (F), erm morphant (G) and itga5-erm double morphant (H). The otic region where sox3 normally downregulates is indicated. Scale bar, 50 μm. |
|
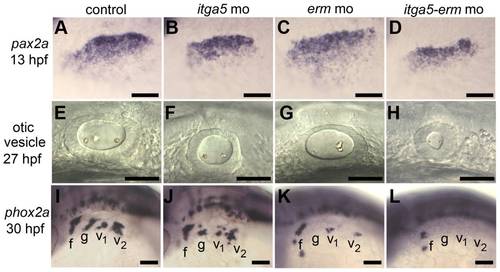
itga5 and erm interact during otic and epibranchial development. (A–D) Otic/epibranchial expression of pax2a at 13 hpf. (E–H) Otic vesicle morphology in at 27 hpf. (I–L) phox2a expression in epibranchial ganglia at 30 hpf. Positions of facial (f), glossopharyngeal (g) and vagal (v1 and v2) ganglia are indicated. All images show lateral views with dorsal up and anterior to the left. Scale bar, 50 μm. |
|
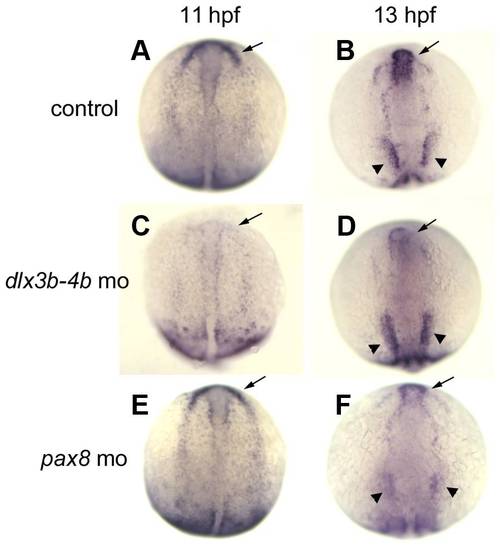
Differential spatial regulation of itga5 by dlx3b/4b and pax8. (A–F) itga5 expression at 11 hpf and 13 hpf in control embryos (A, B), dlx3b-dlx4b double morphants at (C, D), and pax8 morphants (E, F). Regions where expression normally upregulates in precursors of anterior placodes (arrows) and otic/epibranchial precursors (arrowheads) are indicated. Images show dorsal views with anterior to the top. |
|
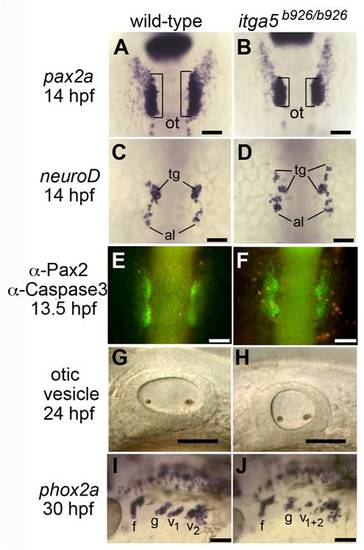
Abnormal development of posterior placodes in itga5b926/b926 mutants. (A, B) pax2a expression at 14 hpf in the otic/epibranchial domain in a wild-type embryo (A) and itga5 mutant (B). Otic placodes (o, brackets) are indicated. (C, D) neuroD expression at 14 hpf in a control embryo (C) and itga5 morphant (D). Precursors of the trigeminal ganglion (tg) and anterior lateral line (al) are indicated. (E, F) Immunolocalization of Pax2 (green) and Caspase 3 (red) in a wild-type embryo (E) and itga5 mutant (F). (G, H) Otic vesicles at 24hpf in a wild-type embryo (G) and itga5 mutant (H). (I, J) phox2a expression in epibranchial ganglia at 30 hpf in a wild-type embryo (I) and itga5 mutant (J). Facial (f), glossopharyngeal (g), and vagal ganglia (v1+v2) are indicated. A–E are dorsal views with anterior to the top; G–J are lateral views with anterior to the left. Scale bar, 50 μm. |
|
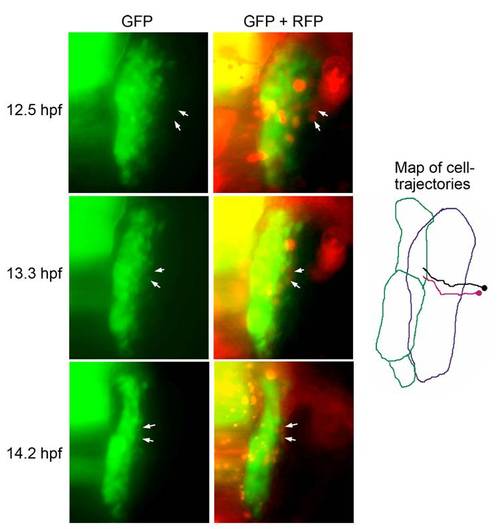
Recruitment of lateral cells into the pax2a:GFP domain. Representative frames from a movie of a pax2a:GFP transgenic embryo injected with cmv:RFP plasmid DNA. RFP-positive cells originating from a position lateral to the otic/epibranchial domain were tracked as they entered the pax2a:GFP domain and activated expression of GFP. White arrows indicate the positions of two cells with respect to domains of GFP alone or both GFP and RFP. A map of the migration patterns of the two tracked cells is indicated, with the purple and green borders marking the initial and final positions, respectively, of the pax2a:GFP domain. |
|
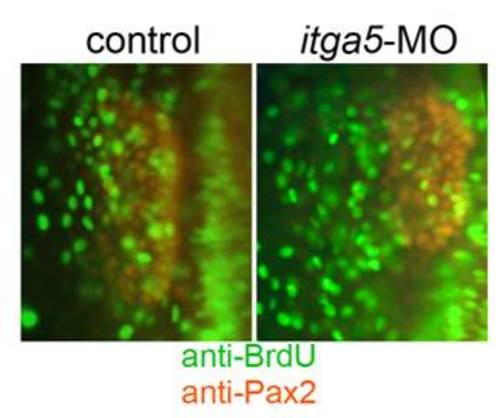
Knockdown of itga5 does not alter proliferation. Embryos were incubated in BrdU beginning at 11.5 hpf, fixed at 13.5 hpf and immunostained for BrdU (green) and Pax2a (red). |

