
Image
|
Figure Caption
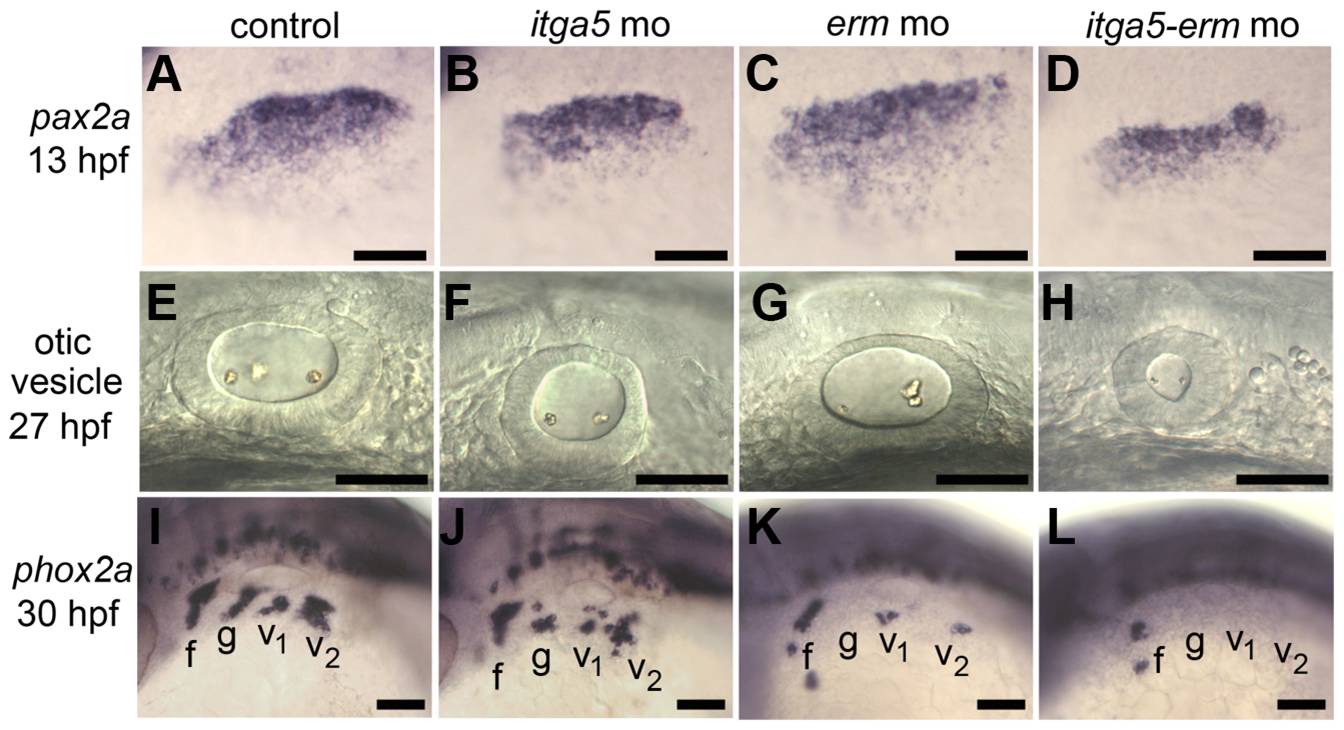
Fig. 8 itga5 and erm interact during otic and epibranchial development.
(A–D) Otic/epibranchial expression of pax2a at 13 hpf. (E–H) Otic vesicle morphology in at 27 hpf. (I–L) phox2a expression in epibranchial ganglia at 30 hpf. Positions of facial (f), glossopharyngeal (g) and vagal (v1 and v2) ganglia are indicated. All images show lateral views with dorsal up and anterior to the left. Scale bar, 50 μm.
Acknowledgments
This image is the copyrighted work of the attributed author or publisher, and
ZFIN has permission only to display this image to its users.
Additional permissions should be obtained from the applicable author or publisher of the image.
Full text @ PLoS One