- Title
-
Def6 Is Required for Convergent Extension Movements during Zebrafish Gastrulation Downstream of Wnt5b Signaling
- Authors
- Goudevenou, K., Martin, P., Yeh, Y.J., Jones, P., and Sablitzky, F.
- Source
- Full text @ PLoS One
|
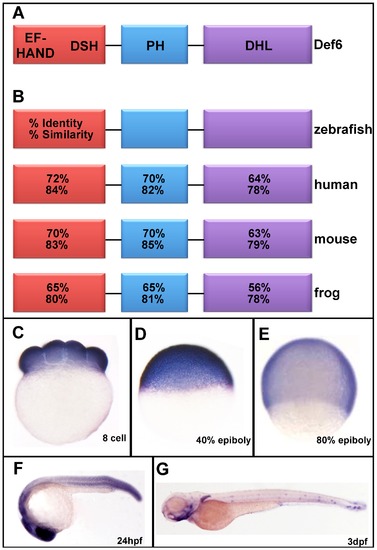
Zebrafish def6 is dynamically expressed during development. (A) Schematic representation of the def6 protein domain arrangement consisting of an N-terminal putative Ca2+-binding EF-hand domain followed by a def6/swap-70 homology (DSH), a pleckstrin-homology (PH) domain and a C-terminal Dbl-homology-like (DHL) domain. (B) Sequence identity and similarity of the various def6 domains between different species as indicated. (C-E) Def6 is ubiquitously expressed at the (C) 8-cell stage, (D) 40% epiboly and (E) 80% epiboly stages. (F) At 24hpf, def6 transcripts are found in the developing brain, somite boundaries and tail. (G) The expression pattern of def6 becomes more restricted at 3dpf where mRNA can be detected in the pharyngeal arches, medial and pectorial fins and anterior and posterior neuromasts of the lateral line. EXPRESSION / LABELING:
|
|
Def6 morphants display defects associated with abnormal gastrulation movements. (A–C) Zebrafish embryos uninjected (wt), or injected with 2.5 or 5 ng def6 splice MO, respectively, are shown at the 1-somite stage. (D) The angle between the anterior- and posterior- most end was measured at the 1-somite stage and the average angle is depicted in degrees. Two-tailed Student′s t-tests showed a significant (p<0.001; three asterisks) increase in the angle after injection of 2.5 ng def6 MO versus wt and an additional significant (p<0.001; three asterisks) increase in 5 ng def6 MO-injected embryos when compared to wt. (E) Def6 MO-injected embryos show a reduction in overall length at 3 dpf (wt at the top; increasing severity of phenotype in def6 MO-injected embryos towards the bottom, defined as mild, moderate and severe, respectively). (F) The length of 20 morphants injected with 2.5 ng def6 MO was measured and normalised to the length of the wt control embryos. Two-tailed Student′s t-tests showed a significant (p<0.001; three asterisks) decrease in length after injection of 2.5 ng def6 MO versus wt embryos. (G) The phenotypes of the embryos were scored at 3 dpf and the percentages of normal/mild (blue bar), moderate (green bar) and severe (red bar) morphology are shown. PHENOTYPE:
|
|
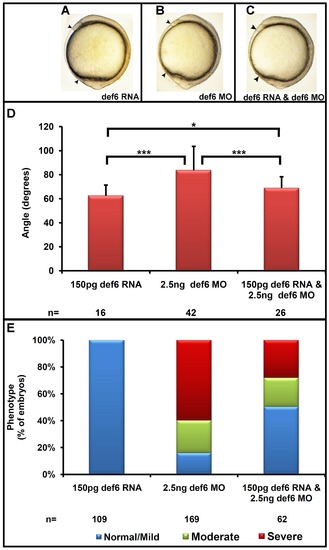
Def6 RNA rescues the def6 MO-induced phenotype. (A–C) Def6 splice MO was injected alone (2.5 ng) or together with def6 RNA (150 pg). As a control, def6 RNA was also injected alone (150 pg). Embryos are shown at the 1-somite stage. (D) The angle between the anterior- and posterior-most embryonic structures was measured in at least 20 embryos and the average angle is shown on the graph in degrees. ANOVA single factor and two-tailed Student′s t-tests showed a significant (p<0.001; three asterisks) increase in the angle after injection of 2.5 ng def6 MO and a significant (p<0.001; three asterisks) decrease in the angle after addition of def6 RNA. The angle measured between injected controls and rescued embryos was also statistically significant (p<0.05; one asterisk), suggestive of a partial rescue. (E) The phenotypes of the embryos from three independent experiments were scored at 3 dpf and the percentages of normal/mild (blue bar), moderate (green bar) and severe (red bar) morphology are shown. Representative images of embryos are shown in Figure 2 panel E. PHENOTYPE:
|
|
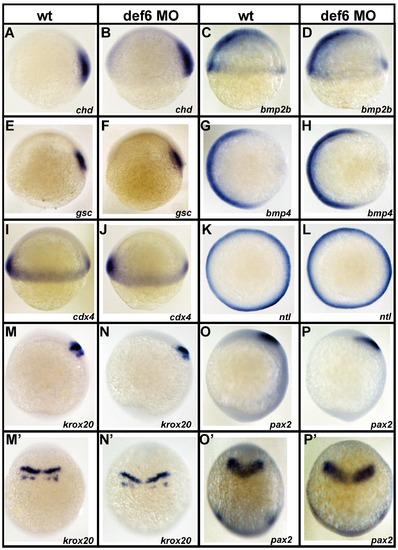
Knockdown of def6 does not alter mesodermal cell fate specification and anterior-posterior patterning. Uninjected and def6 MO-injected embryos were fixed at 6 hpf or 10 hpf and in situ hybridisation was carried out with the indicated probes. Chordin (chd; A and B; 21/21 embryos) and goosecoid (gsc; E and F; 15/15 embryos) are expressed in the dorsal mesoderm and specify dorsal cell fates. Bone morphogenetic proteins (bmp2b; C and D; 18/18 embryos; bmp4; I and J; 15/15 embryos) are involved in ventral cell fate specification. The non-axial marker caudal homeobox transcription factor 4 (cdx4; I and J; 19/19 embryos) and the mesendodermal marker no-tail (ntl; K and L; 31/31 embryos) are also shown. The expression pattern of all these genes in wt and def6 morphants was indistinguishable at 6 hpf, indicating normal cell fate specification in def6 MO-injected embryos. At 10 hpf, expression of the anterior specific genes krox20 (M and N; 37/41 embryos) and pax2 (O and P; 16/19 embryos,) persisted in def6 MO-injected embryos indicating that no anterior structures were deleted. The expression domain of these markers was posteriorly shifted and expanded in def6 MO-injected embryos in comparison to wt siblings (M′–P′) when viewed from the dorsal side. Lateral views (A–F, I, J, M–P), animal pole views (G, H, K, L) and dorsal views (M′–P′) with anterior to the top are shown. |
|
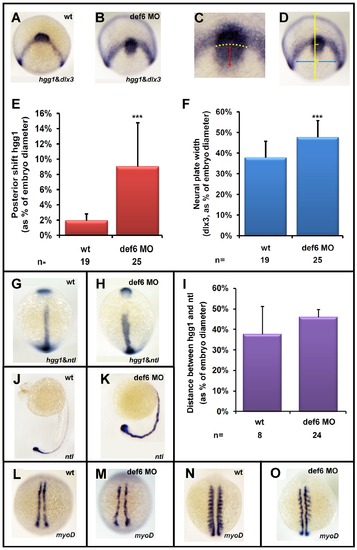
The def6 MO-mediated knockdown phenotype induces CE movement defects. Uninjected (wt) or embryos injected with def6 MO were fixed at tail-bud stage and in situ hybridisations were carried out with probes to hgg1 and dlx3 (A,B). ImageJ software was utilised to analyse the staining patterns, measuring the posterior shift of the hgg1 staining (red double-headed arrow) in relation to the arc formed by dlx3 expression (yellow dotted arc) (C), and measuring the width of the dlx3 staining (blue double-headed arrow) at a constant distance (1/4 of the embryo width) from the dlx3 arc when the embryo was positioned dorsally (D). (E and F) The measured distances were plotted as the average posterior shift (E) or width (F) as a percentage of the total width of the embryo. Two-tailed Student′s t-tests were carried out between groups indicated, and were of statistical significance (p<0.001; three asterisks). This experiment has been repeated at least three times; a representative experiment is depicted here. Zebrafish embryos uninjected (wt) or injected with def6 MO (2.5 ng) were also stained for hgg1/ntl (G, H; statistical analysis shown in Panel I), ntl (J, K) and myoD (L-O-) expression. Images G, H, L, M are embryos at tail-bud stage. Images J. K show embryos at 24 hpf. Images N, O show embryos at the 10-somite stage. G, H, L-O are dorsal views with anterior to the top; J, K are lateral views with anterior to the left. |
|
Def6 MO induced-defects resemble those of wnt5b morphants. Embryos were injected with def6 MO (2.5 ng) or wnt5b MO (5 ng) and development was assessed at different stages. (A–C) 1-somite stage, arrowheads indicate the anterior- and posterior-most structures of the embryos. (D) Statistical analysis of the angle between the anterior- and posterior- most embryonic structures. (E–G) 25-somite stage, def6 and wnt5b MO-injected embryos show brain, somite and tail defects when compared to wt embryos. The tail abnormalities are magnified on E′–G′′. PHENOTYPE:
|
|
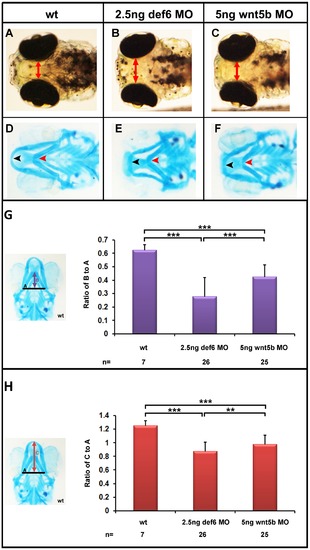
Craniofacial defects in def6 and wnt5b MO-injected embryos. (A–C) 4 dpf, the distance between the eyes is indicated with a double-headed arrow. Def6 and wnt5b MO-injected embryos exhibit a ‘hammerhead’-like phenotype. (D–F) Alcian Blue staining of the cartilage in the head region of 4 dpf embryos. Meckel′s cartilage is indicated with a black arrowhead and does not extend anteriorly beyond the eyes in def6 and wnt5b MO-injected embryos. The ceratohyal is indicated with a red arrowhead and is more posteriorly shifted in the two groups of morphants. Image E; representative image of 105/109 embryos, Image F; representative image of 89/92 embryos. (G) Representative wt embryo and measures taken are shown on the left. Line A was drawn as a baseline for further measurements and also served to normalise distance B. Line B is the distance from line A to the anterior end of the ceratohyal. The ratio of distance B divided by distance A is indicated on the graph. Two- tailed Student′s t-tests indicated a significant (p<0.001; three asterisks) decrease in this ratio in the def6 MO-injected embryos versus wt siblings and between wnt5b MO-injected embryos versus wt siblings. (H) Representative wt embryo and the measures taken are shown on the image on the left. Line A, as before, was used to normalise distance C. Line C is the distance from line A to the anterior end of Meckel′s cartilage. The ratio of this distance is shown on the graph. Injecting 2.5 ng of def6 MO resulted in a significant (p<0.001; three asterisks) decrease in this ratio as determined by two-tailed Student′s t-tests; similarly injection of 5 ng wnt5b MO resulted in a significant (p<0.001; three asterisks) decrease in this ratio. PHENOTYPE:
|
|
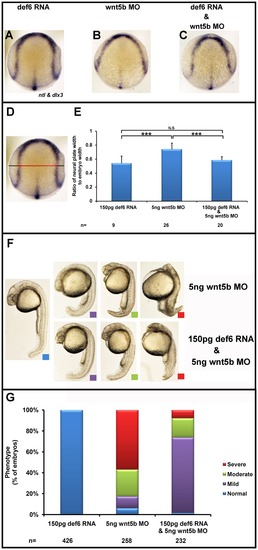
Def6 RNA rescues the CE movement defects observed in wnt5b morphants. Embryos injected with def6 RNA (150 pg), wnt5b MO (5 ng) alone and together at the 1–2 cell stage were fixed at tail-bud stage (10 hpf), and stained for dlx3 (marks the anterior borders of the neural plate) and ntl (marks the presumptive notochord) expression. (A–C) Expression of dlx3 shows restoration of the wider neural plate in the embryos co-injected with def6 RNA and wnt5b MO. Def6 RNA was also sufficient to rescue the reduced anterior extension of the presumptive notochord as revealed by ntl expression. (D) Representative embryo at tail-bud stage viewed from the dorsal side with anterior to top. The measures taken are shown. The black line indicates the width of the embryo whereas the red double-headed arrow is the width of the neural plate. (E) The ratio of the width of the neural plate divided by the width of the embryo was quantified for each category of embryos. ANOVA single factor indicated a significant (p<0.001) difference between the three groups of embryos. Two-tailed Student′s t-tests showed a significant (p<0.001, three asterisks) increase in this ratio in wnt5b morphants versus def6 RNA-injected embryos and statistical significance (p<0.001; three asterisks) in wnt5b MO-injected embryos versus embryos co-injected with def6 RNA and wnt5b MO. There was no statistical difference (N.S) between def6 RNA only versus rescued embryos. (F) Embryos at 24 hpf were morphologically analysed and separated into four categories according to their phenotype: normal (blue box), mild (purple box), moderate (green box), and severe (red box). (G) The phenotypes of the embryos from three independent experiments were scored and the percentages of normal (blue bar), mild (green bar), moderate (yellow bar) and severe (red bar) phenotypes were plotted on the graph. |
|
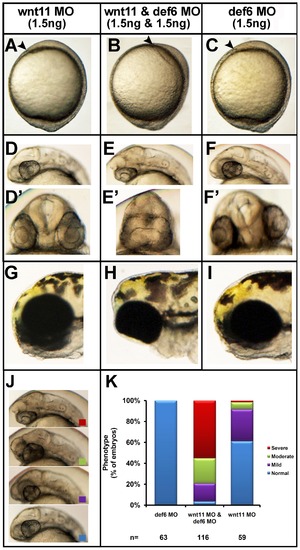
Synergy between def6 and wnt11 MO-mediated knockdown results in severe phenotype. Zebrafish embryos were injected with wnt11 MO (1.5 ng) and def6 MO (1.5 ng) separately and together. Development was assessed at different stages. (A–C) Tail-bud stage (10 hpf), the anterior-most structure is indicated with an arrowhead. (D–F) 28 hpf, co-injection with def6 and wnt11 MOs results in no forebrain structures anterior to the eyes (D′–F′) the same embryos are shown from the front; note complete fusion of the eyes in the double-knockdown embryos. (G–I) 3 dpf, double knockdown embryos have their eyes completely fused in comparison to def6 or wnt11 MO-injected embryos. (J) The phenotypes of 28 hpf embryos were scored morphologically into 4 categories. Representative embryos of normal (blue box), mild (purple box), moderate (green box) and severely affected (red box) morphants are shown. (K) The phenotypes of the embryos from three independent experiments were scored and the percentages of normal (blue bar), mild (purple bar), moderate (green bar) and severe (red bar) are indicated. PHENOTYPE:
|
|
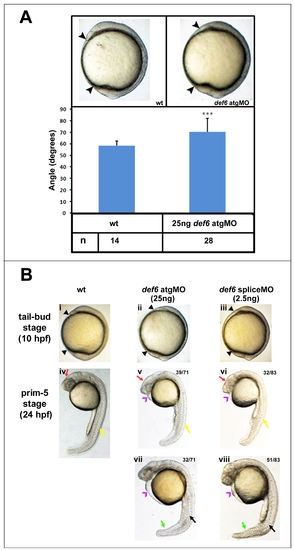
Injection of def6 ATG MO or splice MO result in embryos with a similar phenotype. (A) Injections with 25 ng def6 ATG MO leads to embryos with a reduced body axis (black arrowheads) when compared to wild-type controls. Two-tailed Student t-tests indicate a significant (p<0.001; three asterisks) increase in the angle between the most anterior and posterior embryonic structures of def6morphants in comparison to WT embryos. (B) Morphological analysis showing the similarities between ATG MO- (ii, v, vii) and splice MO- (iii, vi, viii) injected embryos compared to WT siblings (i, iv). Both MOs result in embryos with a reduced body axis at tail-bud stage (black arrowheads). At 24 hpf, both MOs result in morphants with head (red arrows), somite (yellow arrows) and tail (green arrows) defects as well as heart oedema (purple arrowheads) and an undulated notochord (black arrows). Images v and vi show moderately affected embryos (v; 39/71 ATG MO and vi: 32/83 splice MO injected embryos). Images vii and viii show severely affected embryos (vii; 32/71 def6 ATG MO- and viii; 51/83 def6 splice MO-injected embryos) at 24hpf. |
|
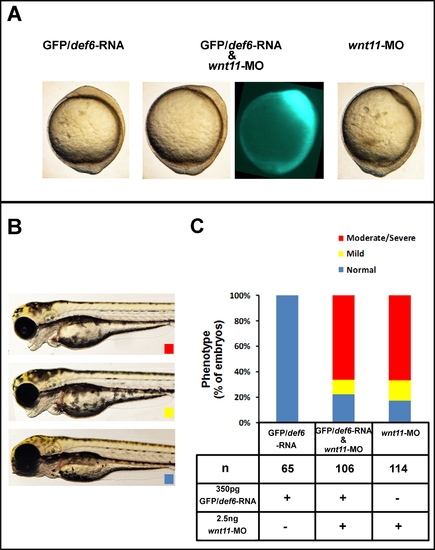
Def6 and Wnt11 do not act in the same linear pathway. (A) Tail-bud stage (10 hpf); GFP/def6 RNA, although detectable (green), failed to rescue the CE movement defects caused by MO-mediated knockdown of wnt11. (B) Embryos (3 dpf) were scored morphologically into three categories: normal (blue box), mild (yellow box) characterised by mild cyclopia and moderate/severe (red box) characterised by complete cyclopia and no forebrain structures anterior to the eyes. (C) The phenotypes of the embryos from three independent experiments were scored and the percentages of normal/WT (blue bar), mild (yellow bar), and moderate/severe (red bar) are indicated. Injections with GFP/def6 RNA and wnt11 MO alone were performed in parallel on the same clutch of embryos. PHENOTYPE:
|

