
- Title
-
The L6 domain tetraspanin Tm4sf4 regulates endocrine pancreas differentiation and directed cell migration
- Authors
- Anderson, K.R., Singer, R.A., Balderes, D.A., Hernandez-Lagunas, L., Johnson, C.W., Artinger, K.B., and Sussel, L.
- Source
- Full text @ Development
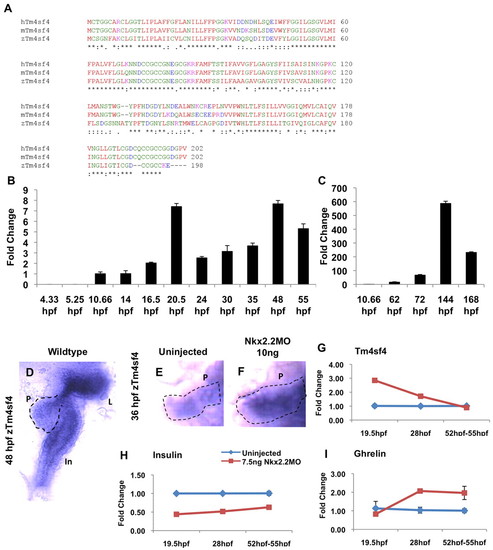
The tm4sf4 gene and regulation by nkx2.2a is conserved in zebrafish. (A) CLUSTAL W species alignment between human, mouse and zebrafish Tm4sf4. Identical (*), highly conserved (:) and weakly conserved (.) amino acids are indicated. Small/hydrophobic residues (red), acidic residues (blue), basic residues (magenta), hydroxyl/amine/basic residues (green) are shown. (B,C) Temporal qRT-PCR tm4sf4 mRNA analysis of early (B) and late (C) stage zebrafish embryos. (D-F) tm4sf4 in situ hybridization on wild-type (D,E) and nkx2.2a morphant (F) embryos. In, intestine; L, liver; P, pancreas. Images taken at 20× magnification. (G-I) qRT-PCR comparing uninjected (blue) and nkx2.2a morphant (red) embryo expression of tm4sf4 (G), insulin (H) and ghrelin (I). Error bars represent s.e.m. |
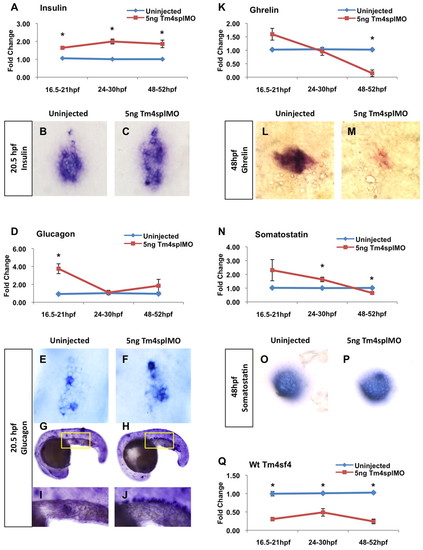
tm4sf4 inhibits α and β cell specification, and is necessary for µ cell fates. (A-P) Hormone mRNA levels were measured by qRT-PCR comparing uninjected (blue) and tm4sf4 morphant (red) zebrafish embryos: insulin (A), glucagon (D), ghrelin (K), somatostatin (N). Hormone mRNA expression pattern was determined by in situ hybridization comparing uninjected and tm4sf4 morphant embryos at 20.5 hpf for insulin (B,C) and glucagon (E-J), and at 48 hpf for ghrelin (L,M) and somatostatin (O,P). All images were taken at 40× magnification except G,H taken at 10×; yellow boxes represent areas enlarged in I and J. (Q) Knockdown efficiency of Tm4splMO was determined at all stages. Error bars represent s.e.m. *P<0.05. EXPRESSION / LABELING:
PHENOTYPE:
|
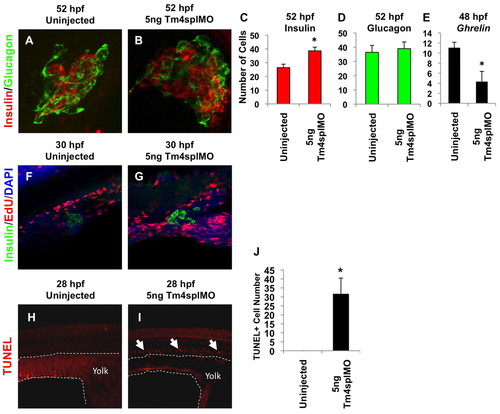
β cells are increased independently of proliferation, ε cells are decreased and aberrant α cells undergo apoptosis as a consequence of tm4sf4 loss. (A,B) Immunofluorescence of insulin (red) and glucagon (green) in uninjected (A) and tm4sf4 morphant (B) zebrafish embryos at 52 hpf. Confocal images were taken at 25× magnification with 2× digital zoom. (C-E) Total β (C) and α (D) cells were counted from confocal z-stacks (n=6). Total μ cells (E) were counted from in situ hybridization 20× images (n=6). (F,G) β cell proliferation was assessed by confocal microscopy of EdU (red) incorporation and immunofluorescence for insulin (green) in uninjected (F) and tm4sf4 morphant (G) embryos. (H-J) TUNEL assay to assess apoptotic cells in the presumptive intestine of 28 hpf embryos. Arrows indicate TUNEL+ cells. Dashed line delineates the yolk. Error bars represent s.e.m. *P<0.05. |
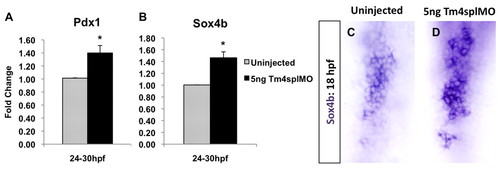
pdx1 and sox4b expression are increased in tm4sf4 morphant zebrafish embryos. (A,B) mRNA levels were measured at 24-30 hpf comparing uninjected embryos (gray) and tm4sf4 morphants (black) for pdx1 (A) and sox4b (B) by qRT-PCR. Error bars represent s.e.m. *P<0.05. (C,D) sox4b expression pattern was analyzed by in situ hybridization at 18 hpf. EXPRESSION / LABELING:
|
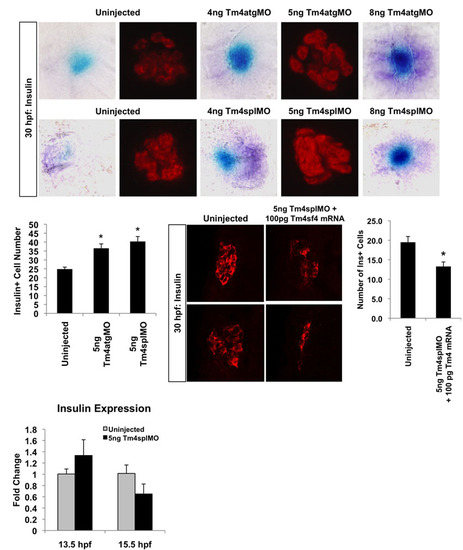
Tm4atgMO and Tm4splMO induce the same phenotype in a dose-dependent manner and tm4sf4 mRNA rescues the phenotype.30 hpf insulin mRNA expression was visualized by in situ hybridization and fluorescence in situ hybridization (FISH) and was compared between uninjected embryos and embryos injected with 4 ng, 5 ng or 8 ng of either Tm4atgMO or Tm4splMO at 30 hpf. tm4sf4 mRNA (100 pg) was co-injected with 5 ng Tm4splMO. From FISH, insulin+ cells were quantified and represented graphically. An earlier insulin phenotype was not seen at 13.5 and 15.5 hpf by qRT-PCR (ten pooled embryos per sample). Error bars represent s.e.m. *P<0.05. |
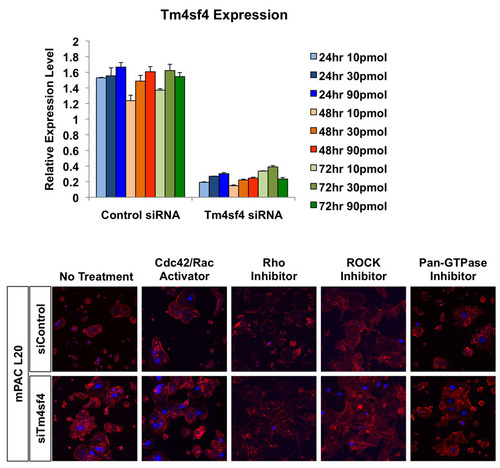
siTm4sf4 optimization and cell morphology analysis with Rho pharmacological effectors. siControl or siTm4sf4 (10, 30 or 90 pmol) were transfected and Tm4sf4 mRNA levels were measured 24, 48 or 72 hours later by qRT-PCR. Migrated mPacL20 cells transfected with 10 pmol of siControl or siTm4sf4 were stained with Rhodamine-phalloidin (red) and DAPI (blue) and gross cytoskeleton phenotypes were analyzed to verify activity of drug treatments. |
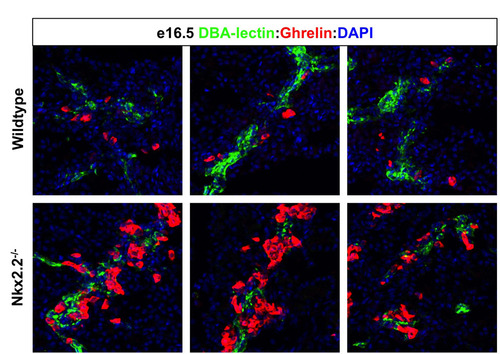
Ghrelin cells are clustered at pancreatic ducts in Nkx2.2-/- mice when Tm4sf4 levels are upregulated. Immunofluorescence for lectin (green) and ghrelin (red) on e16.5 wild-type and Nkx2.2-/- whole embryos. Images were acquired at 40× magnification. |
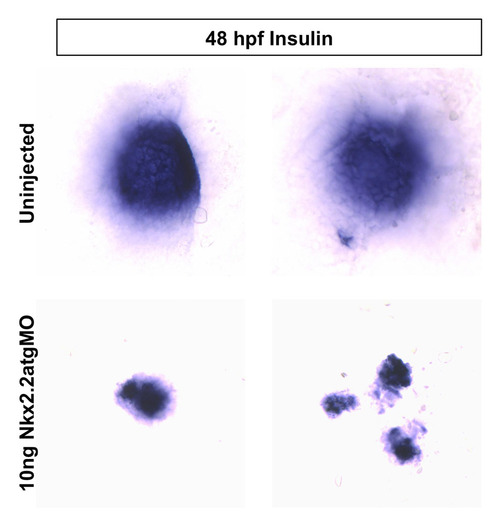
nkx2.2a morphant β cells might have defects in migration. insulin mRNA levels and localization were determined by in situ hybridization comparing uninjected and nkx2.2a morphant embryos at 48 hpf. |