
Image
|
Figure Caption
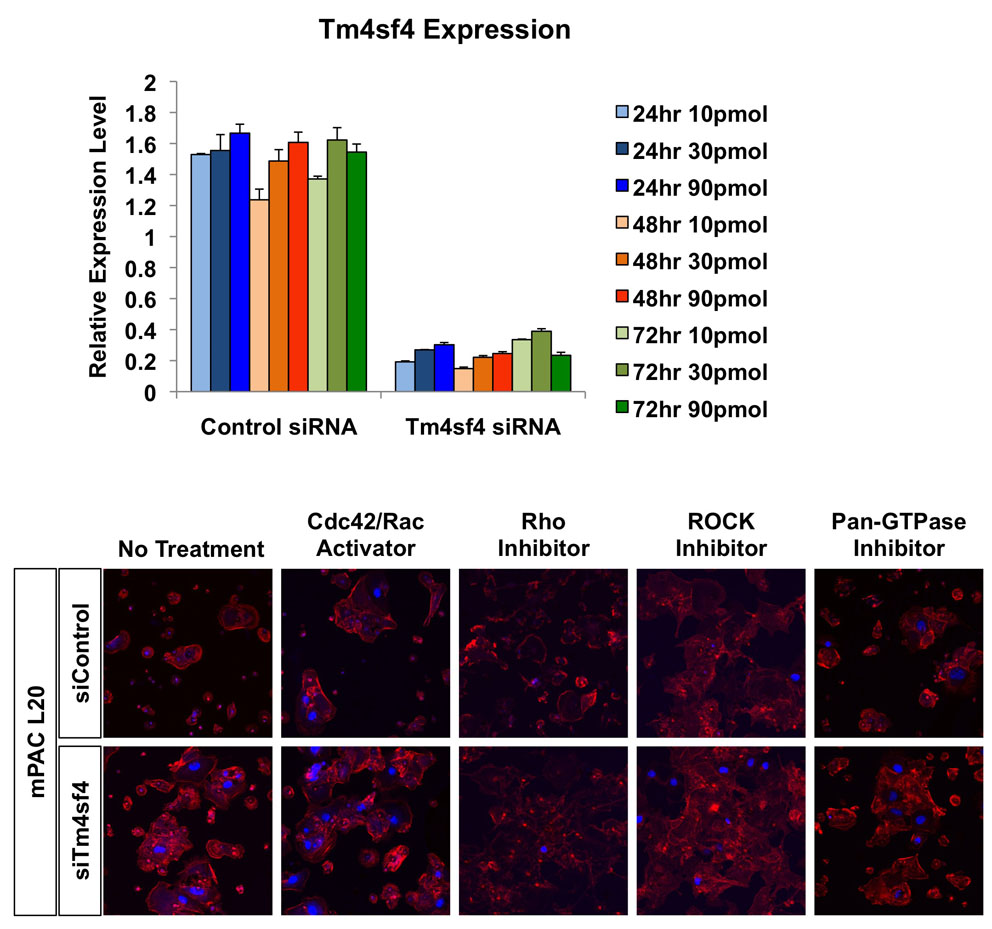
Fig. S5
siTm4sf4 optimization and cell morphology analysis with Rho pharmacological effectors. siControl or siTm4sf4 (10, 30 or 90 pmol) were transfected and Tm4sf4 mRNA levels were measured 24, 48 or 72 hours later by qRT-PCR. Migrated mPacL20 cells transfected with 10 pmol of siControl or siTm4sf4 were stained with Rhodamine-phalloidin (red) and DAPI (blue) and gross cytoskeleton phenotypes were analyzed to verify activity of drug treatments.
Acknowledgments
This image is the copyrighted work of the attributed author or publisher, and
ZFIN has permission only to display this image to its users.
Additional permissions should be obtained from the applicable author or publisher of the image.
Full text @ Development