
|
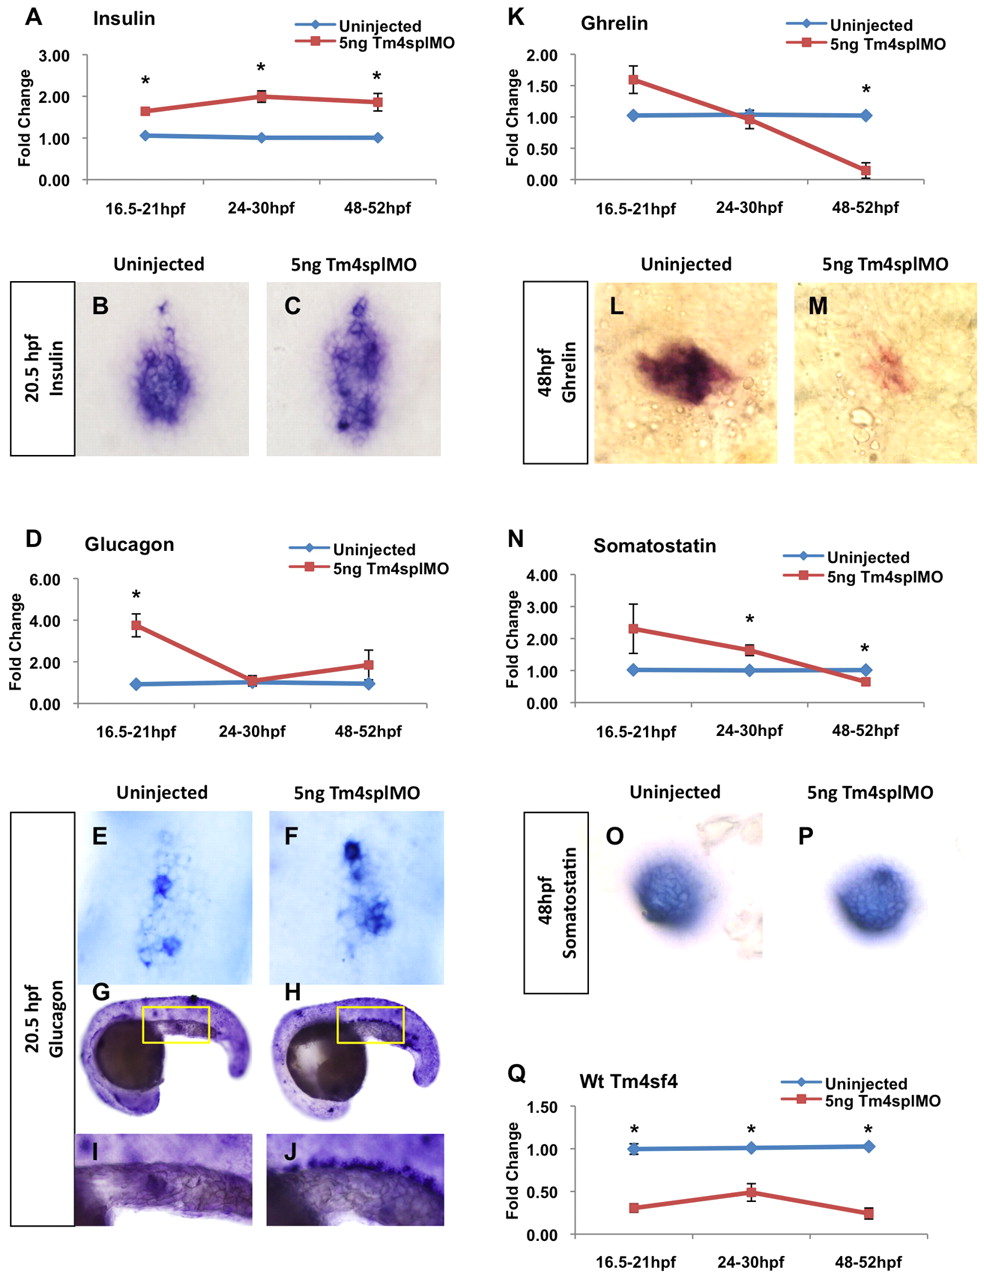
Fig. 4
tm4sf4 inhibits α and β cell specification, and is necessary for µ cell fates. (A-P) Hormone mRNA levels were measured by qRT-PCR comparing uninjected (blue) and tm4sf4 morphant (red) zebrafish embryos: insulin (A), glucagon (D), ghrelin (K), somatostatin (N). Hormone mRNA expression pattern was determined by in situ hybridization comparing uninjected and tm4sf4 morphant embryos at 20.5 hpf for insulin (B,C) and glucagon (E-J), and at 48 hpf for ghrelin (L,M) and somatostatin (O,P). All images were taken at 40× magnification except G,H taken at 10×; yellow boxes represent areas enlarged in I and J. (Q) Knockdown efficiency of Tm4splMO was determined at all stages. Error bars represent s.e.m. *P<0.05.