
|
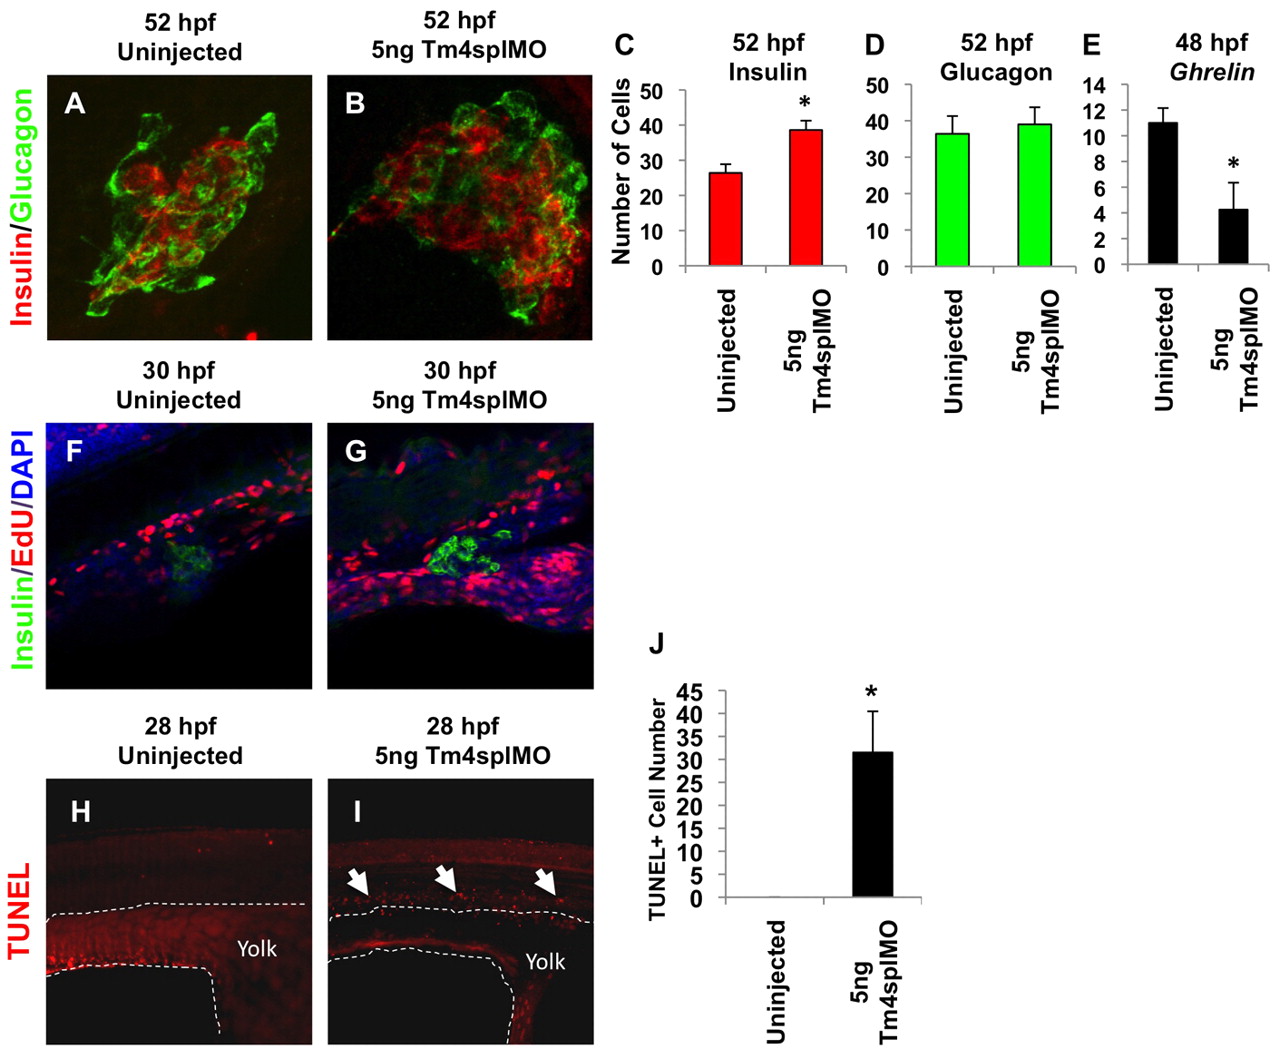
Fig. 5
β cells are increased independently of proliferation, ε cells are decreased and aberrant α cells undergo apoptosis as a consequence of tm4sf4 loss. (A,B) Immunofluorescence of insulin (red) and glucagon (green) in uninjected (A) and tm4sf4 morphant (B) zebrafish embryos at 52 hpf. Confocal images were taken at 25× magnification with 2× digital zoom. (C-E) Total β (C) and α (D) cells were counted from confocal z-stacks (n=6). Total μ cells (E) were counted from in situ hybridization 20× images (n=6). (F,G) β cell proliferation was assessed by confocal microscopy of EdU (red) incorporation and immunofluorescence for insulin (green) in uninjected (F) and tm4sf4 morphant (G) embryos. (H-J) TUNEL assay to assess apoptotic cells in the presumptive intestine of 28 hpf embryos. Arrows indicate TUNEL+ cells. Dashed line delineates the yolk. Error bars represent s.e.m. *P<0.05.