
- Title
-
Sdf1/Cxcr4 signaling controls the dorsal migration of endodermal cells during zebrafish gastrulation
- Authors
- Mizoguchi, T., Verkade, H., Heath, J.K., Kuroiwa, A., and Kikuchi, Y.
- Source
- Full text @ Development
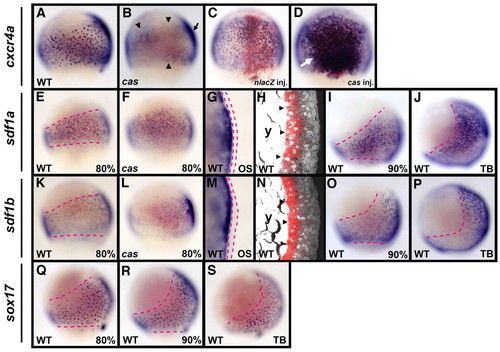
During gastrulation in zebrafish, cxcr4a is expressed in the endoderm, and sdf1a and sdf1b are expressed in the mesoderm. (A-D) cxcr4a expression was examined by whole-mount in situ hybridization in cas mutant embryos and embryos injected with either cas or nlacZ mRNA at the 80% epiboly stage (8.3 hpf). Lateral views, dorsal to the right (A,B), and dorsal views, anterior to the top (C,D). The salt-and-pepper endodermal expression of cxcr4a is absent in the cas mutant, whereas expression in others tissues is still detectable on the dorsal side (arrow in B) and is faintly detectable (arrowheads in B) in other regions of the cas mutant. Although the overexpression of nlacZ mRNA does not affect the salt-and-pepper expression of cxcr4a, cas mRNA injection increases the number of cxcr4a-expressing cells (arrow in D). (E-P) sdf1a and sdf1b expression was examined in wild-type (WT) and cas mutant embryos. Lateral views with dorsal to the right (except for G,H,M,N). (E,F,K,L) At the 80% epiboly stage, neither sdf1a nor sdf1b expression is altered in the cas mutant embryos. (G,M) Optical cross-sections (OS) of 80% epiboly stage embryos show that expression of both sdf1a and sdf1b is present in the hypoblast layer, but not in the epiblast layer (the epiblast layer is indicated by the red dashed lines). Dorsal views, anterior to top. (H,N) Confocal images of sagittal sections of 80% epiboly stage embryos by confocal laser-scanning reflection microscopy (Jékely and Arendt, 2007). Expression of both sdf1a and sdf1b (red) is restricted to the hypoblast layer (arrowheads). y, yolk. (I,J,O,P) The expression of sdf1a and sdf1b in WT embryos at 90% epiboly (9 hpf) and tail bud (TB; 10 hpf) stages. As gastrulation proceeds, both sdf1a- and sdf1b-expressing cells move to the dorsal side of the embryo. (Q-S) sox17 expression in endodermal cells at 80% epiboly, 90% epiboly and TB stages in WT embryos. Lateral views, dorsal to the right. The regions of sox17-expressing endodermal cells from 80% epiboly to TB stages (red dashed lines in Q-S) are comparable to those of sdf1a- and sdf1b-expressing cells (red dashed lines in E,I,J,K,O,P). EXPRESSION / LABELING:
PHENOTYPE:
|
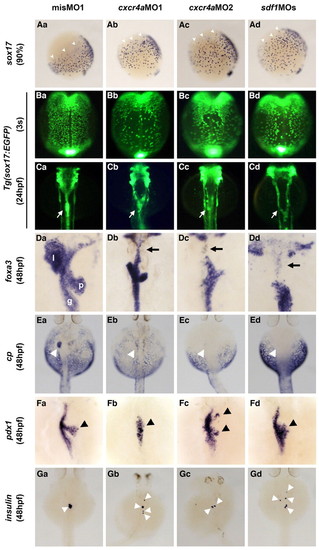
Sdf1/Cxcr4a signaling controls the migration of endodermal cells during gastrulation. (Aa-Ad) sox17 expression was examined by whole-mount in situ hybridization in misMO1-, cxcr4aMO1-, cxcr4aMO2- or sdf1MOs-injected zebrafish embryos at the 90% epiboly (9 hpf) stage. Lateral views, dorsal to the right. The migration of sox17-expressing endodermal cells in the animal-lateral region to the dorsal midline is delayed in the cxcr4aMO1-, cxcr4aMO2- and sdf1MOs-injected embryos (arrowheads). (Ba-Bd) Dorsal views of the mid-trunk region of Tg(sox17:EGFP) transgenic embryos at the three-somite (3s) stage. Anterior is to the top. The migration of EGFP-positive endodermal cells to the dorsal midline is delayed by the knockdown of either cxcr4a or sdf1. (Ca-Cd) Dorsal views of the pharyngeal and foregut regions of Tg(sox17:EGFP) transgenic embryos at 24 hpf. Anterior is to the top. Both the cxcr4a and sdf1 knockdown embryos show a splitting of the anterior gut (arrows). (Da-Gd) The expression of foxa3 (gut and its associated organs), cp (liver), pdx1 (pancreas) and ins (β-cells in pancreas) was examined in misMO1-, cxcr4aMO1-, cxcr4aMO2- or sdf1MOs-injected embryos at 48 hpf. The expression of foxa3 in the anterior part of foregut is lost in both the cxcr4a and sdf1 knockdown embryos (arrows, Db-Dd). Moreover, the liver is not formed (arrowheads, Ea-Ed), the pancreas is small and is not assembled properly (arrowheads, Fa-Fd), and insulin-producing β-cells in the pancreas do not cluster (arrowheads, Ga-Gd) in both the cxcr4a and sdf1 knockdown embryos. l, liver; p, pancreas; g, gut. Note also that no phenotypic differences in endoderm migration and organ formation among the cxcr4aMO1-, cxcr4aMO2- and sdf1MOs-injected embryos can be observed. EXPRESSION / LABELING:
PHENOTYPE:
|
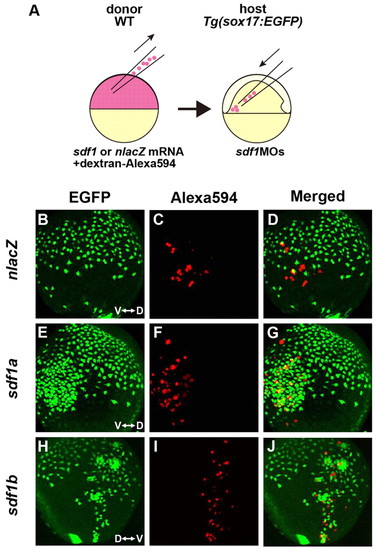
Sdf1 acts as a chemoattractant for cxcr4a-expressing endodermal cells. (A) Schematic representation of the cell-transplantation approach. nlacZ, sdf1a or sdf1b mRNA was co-injected with dextran-Alexa594 into WT donor zebrafish embryos at the one-cell stage. Donor cells from dome-stage embryos were placed in the ventrolateral margin of sdf1MOs-injected host embryos at the shield stage. (B-J) Lateral views of a Tg(sox17:EGFP) transgenic embryo with anterior to the top, at TB stage. V, ventral; D, dorsal. (B-D) nlacZ-expressing donor cells do not attract the EGFP-expressing endodermal cells. (E-J) EGFP-expressing endodermal cells are attracted to the cluster of sdf1a- or sdf1b-expressing cells, which are labeled with dextran-Alexa594 (red). |
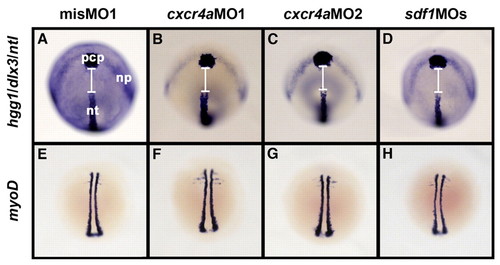
The C&E movements of mesoderm and ectoderm are not affected by Sdf1/Cxcr4a signaling during zebrafish gastrulation. (A-D) The position and shape of the prechordal plate (pcp), the anterior edge of the neural plate (np) and notochord (nt) at the three-somite stage. Embryos were stained for no tail (ntl; notochord marker), hatching gland gene 1 (hgg1; prechordal plate marker) and dlx3 (anterior edge of neuroectoderm) by in situ hybridization. Dorsal views, anterior to the top. No significant differences in the expression patterns of these three genes were found in either the cxcr4a or sdf1 knockdown embryos as compared with misMO1-injected embryos. White lines indicate the gap between the pcp and nt. (E-H) The body length of embryos at the three-somite stage, marked by the expression of myoD. Dorsal views, anterior to the top. The expression pattern of myoD in the cxcr4a or sdf1 knockdown embryos is indistinguishable from that in the misMO1-injected embryos. EXPRESSION / LABELING:
PHENOTYPE:
|
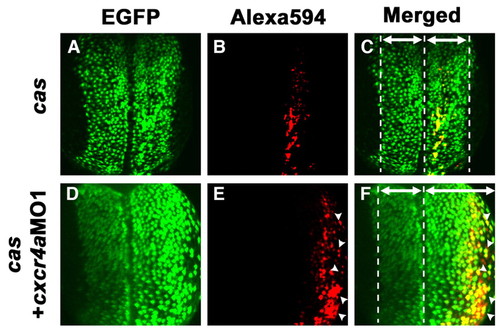
Cxcr4a signaling cell-autonomously regulates the movements of endodermal cells. (A-F) Confocal images of the endodermal cells in Tg(sox17:EGFP) transgenic zebrafish embryos at the three-somite stage. Dorsal views, anterior to the top. One marginal blastomere cell at the 128-cell stage has been transformed into an endodermal fate by the misexpression of cas mRNA. The injected cell was labeled with dextran-Alexa594. (A-C) The progeny of the injected cell intermingle with EGFP-expressing endodermal cells. (D-F) The migration of both cas mRNA and cxcr4aMO1 co-injected cells was significantly delayed compared with cells injected with cas mRNA only (arrowheads, E,F). (C,F) Note that the width from the midline to the lateral margin of the endodermal cell layer in the cas mRNA + cxcr4aMO1 co-injected embryos is broader than that of the cas mRNA-injected embryos because the movement of the endodermal cells is delayed (areas medial and lateral to the midline are indicated by the double-headed arrows). |
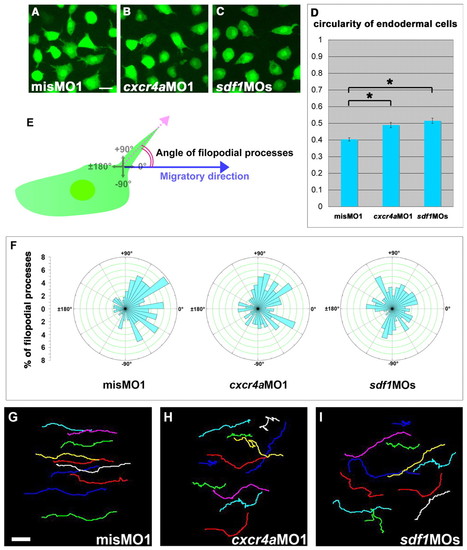
Sdf1/Cxcr4a signaling is required for the correct morphology of endodermal cells during zebrafish gastrulation. (A-C) Confocal images of EGFP-expressing endodermal cells at 90% epiboly from a time-lapse video. The direction of migration is towards the right. The endodermal cells show many filopodial processes in the misMO1-injected embryos, whereas both the cxcr4aMO1- and sdf1MOs-injected endodermal cells have fewer of these processes and are more rounded. (D) Cell circularity from 4-5 randomly chosen cells measured at two consecutive time points (time interval, 10 minutes) from 9-10 independent movies in misMO1- (n=100 cells), cxcr4aMO1- (n=99 cells) and sdf1MOs- (n=87 cells) injected embryos. Cell circularity is calculated as follows: circularity=4πA/p2, where A=area and p=perimeter. Note that the differences between the misMO1 and cxcr4aMO1 values, as well as the differences between the misMO1 and sdf1MOs values, are statistically significant (*P<0.01, Student's t-test). Error bars represent the standard error. (E) Schematic representation of the methods used to measure the angles of the filopodial processes relative to the direction of migration of the endodermal cells. ±180° indicates opposing the direction of migration. (F) Rose diagrams representing the orientation of filopodial processes relative to the direction of migration. The orientation of the filopodia from 4-5 randomly chosen cells was measured at two consecutive time points (time interval, 10 minutes) from 9-10 independent movies in misMO1- (n=100 cells), cxcr4aMO1- (n=99 cells) and sdf1MOs- (n=87 cells) injected embryos. (G-I) The migration tracks of 10-11 individual endodermal cells over a period of 30 minutes. The direction of migration is to the right and the cell position was determined every 30 seconds. Scale bars: 20 μm. EXPRESSION / LABELING:
PHENOTYPE:
|
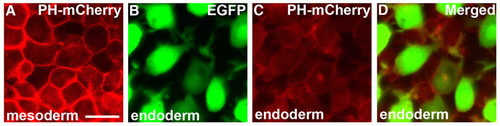
Specific subcellular localization of PH-mCherry is not observed in migrating endodermal cells. (A-D) Confocal analysis of PH-mCherry localization in mesodermal and endodermal cells at the 90% epiboly stage. In mesodermal cells, PH-mCherry is significantly localized at the cell membrane (A), but this is not observed in endodermal cells (B-D). Scale bar: 20 μm. |
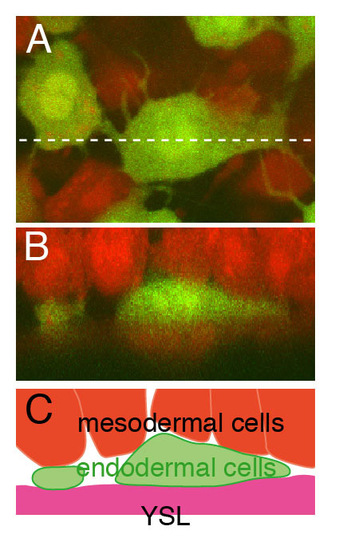
The endodermal cells lie in the deepest layer of the hypoblast. (A) Confocal image of endodermal and mesodermal cells in Tg(sox17:EGFP) embryo at the 90% epiboly stage. Dextran-Alexa594 was injected into a Tg(sox17:EGFP) embryo at the one-cell stage. The endodermal cells, which have many filopodial processes, are yellowish green and mesodermal cells are red. (B) Reconstructed z-section at the level of the dashed line in A. The extra-embryonic YSL is also red. The endodermal cells occupy the space between the mesodermal cells and extra-embryonic YSL. (C) Schematic representation of B. YSL, yolk syncytial layer. EXPRESSION / LABELING:
|
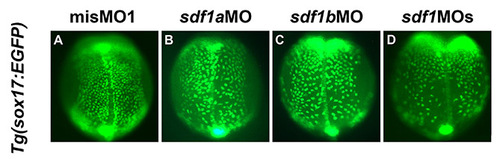
Sdf1a and Sdf1b act redundantly on endodermal cell migration. (A-D) Dorsal views of the mid-trunk region of Tg(sox17:EGFP) transgenic embryos at the three-somite stage. Anterior is to the top. The delay of endodermal dorsal migration was more severe in sdf1a/sdf1b double-knockdown embryos than in single-knockdown embryos of either sdf1a or sdf1b. Moreover, the phenotype on the dorsal migration of endodermal cells in sdf1a knockdown embryos is a little milder than that of sdf1b knockdown embryos. EXPRESSION / LABELING:
PHENOTYPE:
|
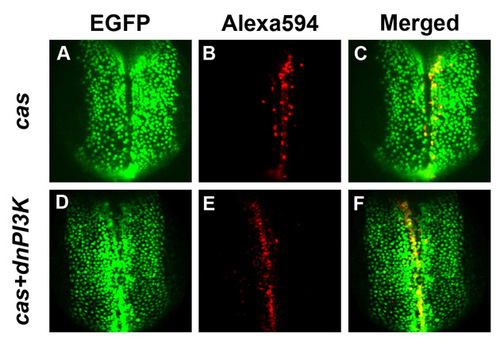
Phosphoinositide 3-kinase (PI3K) signaling does not regulate the movements of endodermal cells. (A-F) Confocal images of endodermal cells in Tg(sox17:EGFP) transgenic embryos at the three-somite stage. Dorsal views, anterior to the top. One marginal blastomere cell at the 128-cell stage has been transformed into an endodermal fate by the misexpression of cas mRNA (2 pg). The injected cell was labeled with dextran-Alexa594. (A-C) The progeny of the injected cell intermingle with EGFP-expressing endodermal cells. (D-F) The migration of cells co-injected with both cas (2 pg) and a dominant-negative form of phosphoinositide 3-kinase (dnPI3K) (4 pg) mRNAs was not changed relative to cells injected with cas mRNA alone. |

Unillustrated author statements |