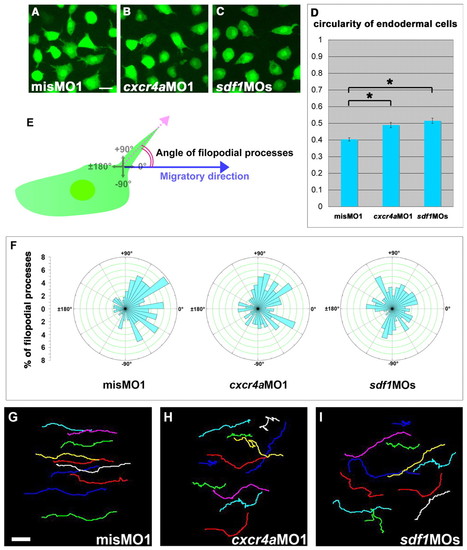
Sdf1/Cxcr4a signaling is required for the correct morphology of endodermal cells during zebrafish gastrulation. (A-C) Confocal images of EGFP-expressing endodermal cells at 90% epiboly from a time-lapse video. The direction of migration is towards the right. The endodermal cells show many filopodial processes in the misMO1-injected embryos, whereas both the cxcr4aMO1- and sdf1MOs-injected endodermal cells have fewer of these processes and are more rounded. (D) Cell circularity from 4-5 randomly chosen cells measured at two consecutive time points (time interval, 10 minutes) from 9-10 independent movies in misMO1- (n=100 cells), cxcr4aMO1- (n=99 cells) and sdf1MOs- (n=87 cells) injected embryos. Cell circularity is calculated as follows: circularity=4πA/p2, where A=area and p=perimeter. Note that the differences between the misMO1 and cxcr4aMO1 values, as well as the differences between the misMO1 and sdf1MOs values, are statistically significant (*P<0.01, Student's t-test). Error bars represent the standard error. (E) Schematic representation of the methods used to measure the angles of the filopodial processes relative to the direction of migration of the endodermal cells. ±180° indicates opposing the direction of migration. (F) Rose diagrams representing the orientation of filopodial processes relative to the direction of migration. The orientation of the filopodia from 4-5 randomly chosen cells was measured at two consecutive time points (time interval, 10 minutes) from 9-10 independent movies in misMO1- (n=100 cells), cxcr4aMO1- (n=99 cells) and sdf1MOs- (n=87 cells) injected embryos. (G-I) The migration tracks of 10-11 individual endodermal cells over a period of 30 minutes. The direction of migration is to the right and the cell position was determined every 30 seconds. Scale bars: 20 μm.
|
