
- Title
-
Cdx4 is required in the endoderm to localize the pancreas and limit {beta}-cell number
- Authors
- Kinkel, M.D., Eames, S.C., Alonzo, M.R., and Prince, V.E.
- Source
- Full text @ Development
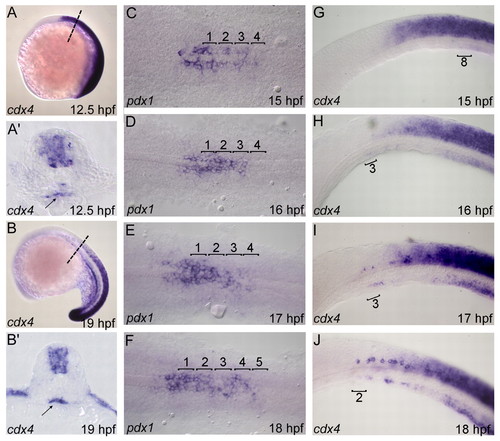
cdx4 is expressed in the endoderm during zebrafish pancreas development. (A-B′) Dashed lines in A,B indicate approximate plane of section in A′,B′. Arrow indicates endoderm. (C-J) Locations of expression domains determined by photographing each embryo under brightfield for either pdx1 or cdx4 expression and under fluorescence to reveal myosin expression in the somites. Images were merged (not shown) to determine the AP location of pdx1 or cdx4 expression. (C-F) Dorsal views of pdx1 expression. Brackets indicate somite level. (G-J) Lateral views of cdx4 expression. Bracket indicates somite adjacent to the anterior-most region of the cdx4 domain. To image endodermal cdx4 expression, the paraxial and lateral plate mesoderm were removed. Magnification: 200x in C-J. EXPRESSION / LABELING:
|
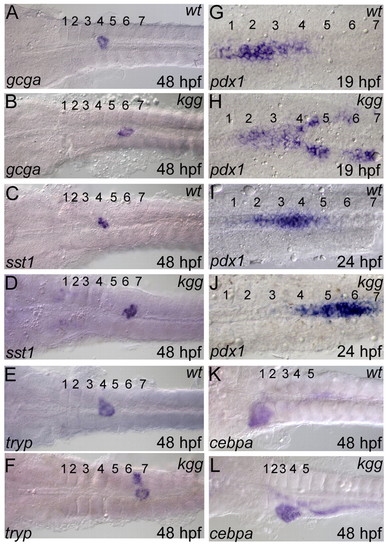
Foregut gene expression is shifted posteriorly in cdx4-/- zebrafish embryos. (A,B) glucagon (gcga) expressed by α-cells in endocrine pancreas. (C,D) somatostatin 1 (sst1) expressed by δ-cells in endocrine pancreas. (E,F) trypsin (tryp) expressed by acinar cells in exocrine pancreas. (G-J) pdx1 expressed by pancreatic precursors and small-intestine precursors. (K,L) cebpa expressed in liver. Numbers indicate somites. Dorsal views. Magnification: 100x, except G-J at 200x. EXPRESSION / LABELING:
PHENOTYPE:
|
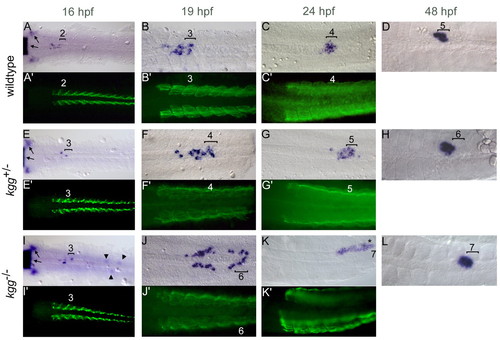
Cdx4 localizes the pancreas in a dosage-dependent fashion. (A-L) In situ hybridization for insulin expression (purple), photographed in brightfield. A,E,I additionally show krox20 expression in rhombomere 5 and neural crest cells (arrows). (A′-C′,E′-G′,I′-K′) Myosin antibody staining (green fluorescence) to reveal somites. Brightfield and fluorescence images were merged for analysis and are shown separately for clarity. Bracket indicates the somite adjacent to the posterior limit of insulin expression. Arrowheads in I indicate posterior ectopic krox20-positive neural crest cells (out of focus) in 16hpf mutants. The asterisk in K indicates the boundary between somite 6 and 7. Dorsal views, anterior to the left. Magnification: 100x for 16hpf panels; all others 200x. EXPRESSION / LABELING:
PHENOTYPE:
|
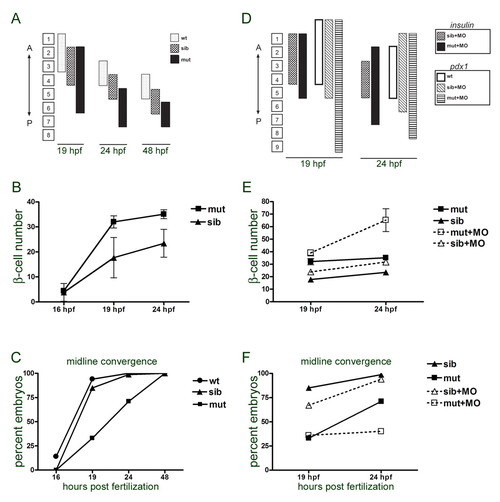
Cdx4 has roles in determining β-cell localization, cell number and in regulating β-cell convergence to the midline during early pancreatogenesis. (A) Summary of Fig. 3 data showing average (modal) insulin domain locations for post-16hpf timepoints relative to somite number (shown as numbered boxes). mut, kgg mutants (cdx4-/-); sib, siblings of kgg mutants, including both heterozygotic and wild-type (wt) zebrafish clutchmates. (B) The number of β-cells increases more rapidly in cdx4-/- embryos than in siblings (mean±s.d.). (C) Midline convergence of β-cells is delayed in cdx4-/- embryos. y-axis indicates percentage of embryos in which β-cells have converged to the midline. (D) Summary of Fig. 5 data showing modal insulin and pdx1 domain locations for Cdx1a-MO-injected kgg mutants and siblings. (E) β-cell number increases further in Cdx1a-MO-injected kgg siblings and mutants (mean±s.d.). (F) Midline convergence is further delayed in Cdx1a-MO-injected kgg siblings and mutants. y-axis indicates percentage of embryos in which β-cells have converged to the midline. Note than in E and F, mutant and sibling data from B and C are included for ease of comparison. Sample sizes for A-C were as follows. Wild type (wt): 16hpf, n=38; 19hpf, n=36; 24hpf, n=60; 48hpf, n=17. Siblings (sib): 16hpf, n=38; 19hpf, n=82 for A and C, n=45 for B; 24hpf, n=80 for A and C, n=40 for B; 48hpf, n=33. Mutant (mut): 16hpf, n=23; 19hpf, n=30; 24hpf, n=24; 48hpf, n=23. Sample sizes for D-F were as follows. insulin data, siblings+Cdx1a-MO (sib+MO): 19hpf, n=24; 24hpf, n=16. Mutant+Cdx1a-MO (mut+MO): 19hpf, n=22; 24hpf, n=10. Sample sizes for D were as follows. pdx1 data, wild type: 19hpf, n=22; 24hpf, n=9. Siblings+Cdx1a-MO (sib+MO): 19hpf, n=15; 24hpf, n=17. Mutant+Cdx1a-MO (mut+MO): 19hpf, n=16; 24hpf, n=20. PHENOTYPE:
|
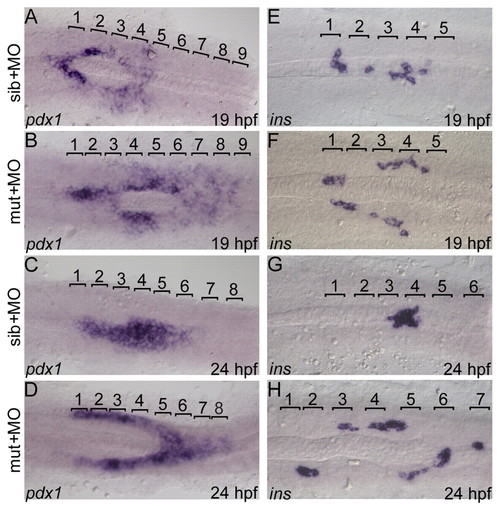
Cdx4 and Cdx1a function redundantly. (A-D) The pdx1 domain is further expanded in zebrafish kgg mutants and siblings following morpholino (MO) knockdown of cdx1a. (E-H) The insulin domain is further expanded, and β-cells show a delay in converging to form the islet, following cdx1a knockdown in kgg mutants and siblings. Numbers indicate somites. Dorsal views. Magnification: 200x. EXPRESSION / LABELING:
PHENOTYPE:
|
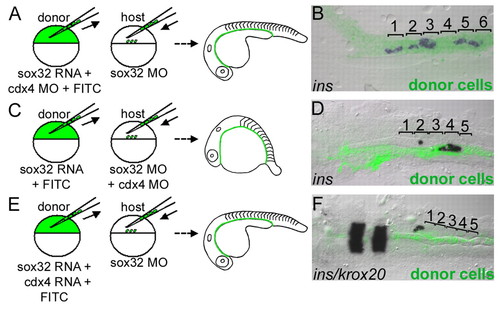
Cdx4 functions in the endoderm to localize the pancreas. (A,C,E) Cell transplantation strategy. Donor and host zebrafish embryos were injected at the one-cell stage with the indicated reagents. At the sphere stage, donor cells were transplanted to host blastoderm margin. (B) cdx4 knockdown in endoderm is sufficient to shift the pancreas posteriorly. (D) Wild-type endoderm rescues the pancreas location in a cdx4-knockdown host. (F) Cdx4 overexpression in endoderm results in insulin expression anterior to the normal pancreatic domain. Embryos at 24hpf, dorsal view. Magnification: 100x. |
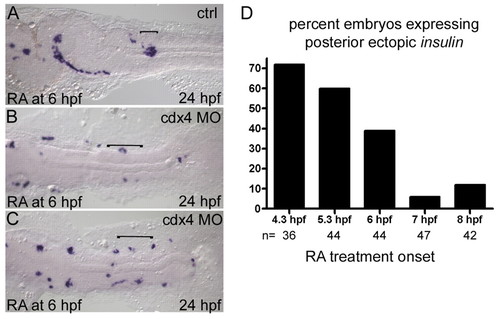
Retinoic acid elicits posterior insulin expression in cdx4 morphants. (A-C) Zebrafish embryos treated at shield stage and fixed at 24hpf. Brackets indicate the normal position of the pancreas in untreated wild-type and cdx4 morphant embryos. (D) Percentage of embryos expressing posterior ectopic insulin in response to RA treatment plus cdx4 knockdown. Average cell numbers (±s.d.) by treatment timepoint were as follows: 4.3hpf, 3.4±1.9; 5.3hpf, 2.6±1.7; 6hpf, 2.3±1.8; 7hpf, 1.7±0.6; 8hpf, 1.4±0.5. Sample sizes for RA-treated embryos, without Cdx4 MO injection, were a minimum of 25 embryos per timepoint. Bars represent the combined results of two independent experiments. Dorsal views, anterior to left. Magnification: 100x. |
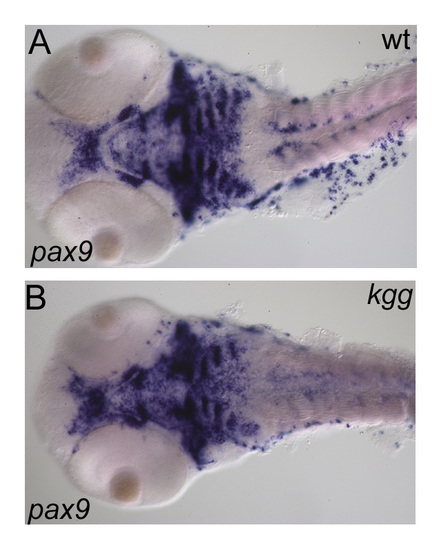
Pharyngeal pax9 expression is not expanded in kgg mutants at 48hpf. (A,B) Ventral view. Magnification: 100x. EXPRESSION / LABELING:
|

kgg phenotype persists into larval stages. The esophageal-intestinal junction, indicated by the black arrow, is shifted posteriorly in kgg larvae at 7dpf. The esophageal region, indicated by asterisks, may be expanded. (A) Wild type. 100x. (A′) Specimen from A shown at 200x. Note the distinct junction between the posterior pharyngeal epithelium, indicated by white arrowheads, and the pale-staining columnar esophageal epithelium. (B) kgg mutant. 100x. The notochord is partially in the plane of section of the somites because of medial-lateral curvature. (B′) Specimen from B shown at 200x. The epithelium posterior to the fifth gill arch is ambiguous in appearance and we could not identify a pharyngeal-esophageal junction. (C) Anterior endodermal epithelium of another kgg specimen, shown at 200x. Wild type, n=4; kgg, n=6. Numbers indicate somites. E, esophagus; IB, intestinal bulb; L, liver; N, notochord; SB, swim bladder; Y, yolk; black arrow, esophageal-intestinal junction; white arrow, fifth gill arch; black arrowhead, pancreas; white arrowhead, epithelium posterior to fifth gill arch. Hematoxylin and Eosin-stained sagittal sections, anterior to left. PHENOTYPE:
|

Unillustrated author statements |