
- Title
-
The chemokine, Sdf-1, and its receptor, Cxcr4, are required for formation of muscle in zebrafish
- Authors
- Chong, S.W., Nguyet, L.M., Jiang, Y.J., and Korzh, V.
- Source
- Full text @ BMC Dev. Biol.
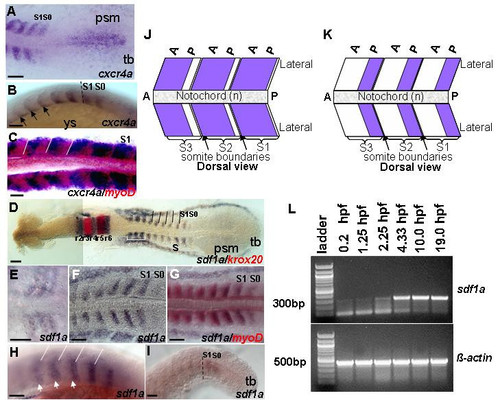
The dynamic expression of cxcr4a and sdf1a during segmentation. Dorsal views (A,C-G,J,K) and lateral views (B,H-I). (A,B) Expression of cxcr4a in posterior trunk. (D-I) RNA in situ hybridization with sdf1a riboprobe (blue). (A,B) High level of cxcr4a transcript in newly formed and posterior somites, 13.5 h and 16 h respectively. In somites, cxcr4a expression is restricted to anterior part. Expression becomes increasingly restricted to anterior part within each somite over time, black arrows. (C) Overlapping expression domain of cxcr4a with myoD (red) is observed, 14 h. (J) Schematic representation of cxcr4a expression (blue) in posterior somites. (D) sdf1a staining covers almost the entire three anterior-most somites indicated by white bracket, while in posterior somites expression is restricted to posterior part, 13 h. (E) Expression in early somites, 11 h. (F,G) Overlap of expression of sdf1a and myoD (red), 14 h. (H) Expression is restricted to the posterior part of each somite, 16.5 h, white arrowheads. (I) Faint expression is detected in forming and newly formed somite, 21 h. (K) Schematic representation of sdf1a expression (blue) in posterior somites. (L) Reverse transcription (RT)-PCR detects continuous presence of transcript of sdf1a during early development. sdf1a transcript is present at low levels before mid-blastula transition (MBT). To confirm results, the PCR products were sequenced. β-actin was used as a positive control. -RT control using β-actin primers without addition of reverse transcriptase, no band was detected (data not shown). Black dashed lines indicate boundary between somite and newly formed somite (B,I). White lines demarcate the somite boundaries (C,H). Abbreviations: a – anterior; p – posterior; psm – presomitic mesoderm; r – rhombomere; s – somite; S0 – forming somite; S1 – newly formed somite; tb – tailbud; ys – yolk sac. Scale bars = 50 μm. EXPRESSION / LABELING:
|
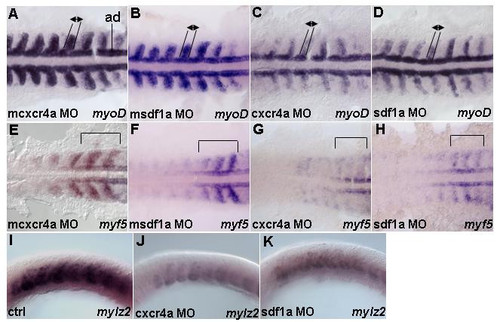
Cxcr4 signaling is required for transcription of myogenic genes in the paraxial mesoderm. Dorsal (A-H) and lateral views (I-K). 13 h embryos hybridized with (A-D) myoD, (E-H) myf5 and (I-K) mylz2 riboprobes. (A,B) mcxcr4a (n = 52/52) and msdf1a morphants (n = 50/61) as controls. Embryos show expression pattern of myoD. (C) cxcr4a (n = 48/50) morphants show myoD transcription is reduced in the paraxial mesoderm, while expression in adaxial cells is unchanged. (D) sdf1a (n = 50/61) morphants show similar reduction of myoD in the paraxial cells but not adaxial cells. Black lines and arrows indicate size of expression domain. In addition, intensity of staining in lateral mesoderm is substantially reduced. (E,F) mcxcr4a (n = 36/36) and msdf1a (n = 49/58) morphants as controls. Embryos show characteristic expression pattern of myf5 in the adaxial cells, somitic mesoderm and presomitic mesoderm. (G) cxcr4a (n = 43/47) morphants have myf5 reduced in both somites and forming somites. (H) sdf1a (n = 56/71) morphants cause similar effects to Cxcr4a knock down. Black brackets indicate a region where pattern and intensity of myf5 staining in the newly formed and forming somites were reduced. (I-K) Control (n = 30). Reduced mylz2 transcription in cxcr4a (n = 30) and sdf1a (n = 30) morphants. Abbreviation: ad – adaxial cells. EXPRESSION / LABELING:
PHENOTYPE:
|
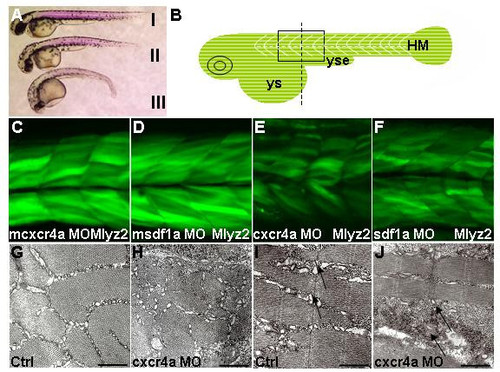
Formation of fast muscle requires Cxcr4a and Sdf1a. Lateral views (A-F), cross-section (G,H), sagittal section (I,J) and dorsal views. (A) Birefringence revealed by polarized light in cxcr4a (II) and sdf1a (III) morphants was reduced compared to control (I), 30 h. (B) Schematic illustrating black box region used for imaging. Start of yolk sac extension as a guide for the center of frame, indicated by dashed line in diagram of zebrafish embryo. (C-F) Single confocal images taken at level of the somite boundary as a guide of depth. Myosin light chain transgenic line, 51 h. (C,D) mcxcr4a (n = 87/87) and msdf1a (n = 31/35) morphants developed normally. (E,F) In representative cxcr4a (n = 63/71) and sdf1a (n = 73/82) morphants, reduction of GFP signal was observed. (G-J) Transmission electron micrograph of cross (G,H) and sagittal (I,J) sections in trunk region of control and cxcr4a morphants respectively, 36 h. A representative cxcr4a morphant clearly shows a reduction in muscle fibrils. (I,J) Black arrows indicate lack or absence of sarcoplasmic reticulum and muscle fibers in some areas of cxcr4a morphant. For clarity, this region of section (J) was selected where there are at least some muscle fibers. Abbreviations: HM – horizontal myoseptum; ys – yolk sac and yse – yolk sac extension. Scale bars = 500 nm. PHENOTYPE:
|
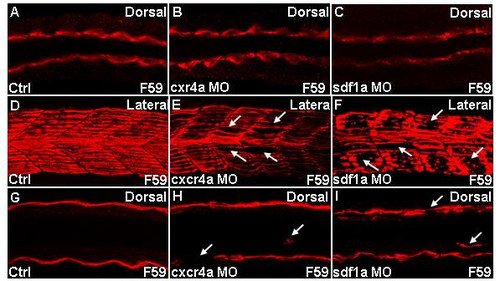
Slow muscle migration defects in cxcr4a and sdf1a morphants. Confocal images of embryos stained for slow myosin using F59 antibody. Dorsal (A-C;G-I) and lateral (D-F) views of embryonic trunk between the fourth and tenth somites. (A-C) Adaxial cells in cxcr4a and sdf1a morphants are identical to that in controls, 19 h. (D-I) Embryos at 25 h. (D-F) Z-stacked images of ten frames. (G-I) Z-stacked images of two frames. (D) Distinct and properly aligned slow fibers are seen in control embryo. (E,F) Gaps are seen in myotomes of representative cxcr4a and sdf1a morphant, indicated by white arrows. (G) Control. (H,I) Loss of fiber at the superficial layer and misrouted slow muscle, indicated by white arrows in representative cxcr4a and sdf1a morphant respectively. Other misrouted slow fibers in morphants are in different planes (data not shown). PHENOTYPE:
|
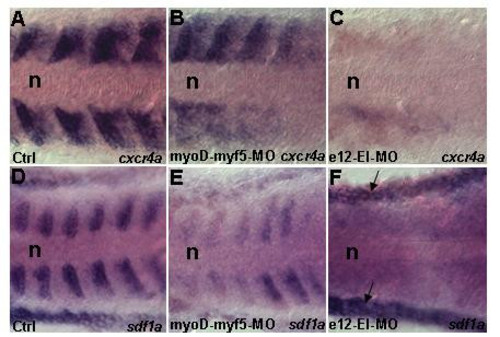
Knockdown of E-box factors affects cxcr4a and sdf1a transcription. Dorsal views (A-F). Embryos between 13–14 h were analyzed. (A,D) Control showing cxcr4a (n = 20) and sdf1a (n = 20) expression respectively. (B,E) Double myoD-myf5 morphants demonstrate reduction of cxcr4a (n = 15/20) and sdf1a (n = 16/20) transcription respectively. This indicates cooperative function of MyoD and Myf5. (C,F) e12 morphants have vast reduction of cxcr4a (n = 20/20) and sdf1a (n = 20/20) transcription, this confirms that E12 is a major regulating factor. Black arrow in F indicates sdf1a staining in the non somitic lateral mesoderm. Abbreviation: n – notochord. EXPRESSION / LABELING:
PHENOTYPE:
|
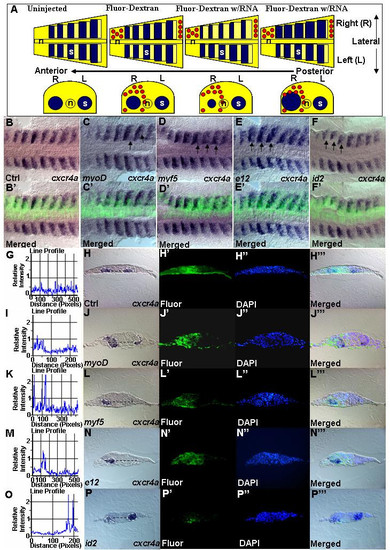
MRFs and co-factors are required for cxcr4a transcription. (A) Schematic showing the outcome of two-cell stage injection. Blue represents a signal of cxcr4a in situ hybridization. Red circles represent fluorescein-dextran on injected side. In control uninjected embryos, transcription analysis with antisense probes will appear symmetrical on left and right sides of flat mount zebrafish embryo. Staining will not differ significantly between left and right sides in both uninjected embryos and control fluorescein-dextran injected embryos. All comparisons were done between opposing pairs of somites. For each set of experiment, a minimum of three embryos between 11–14 h were analyzed using cryosectioning. The uninjected side acts as the internal control. Embryos stained with cxcr4a riboprobe. (B-F') Dorsal views. (B'-F') Composite images of the bright-field and fluorescent image showing one sided distribution of mRNA expressing cells. Increased level of cxcr4a transcript can be seen after misexpression of myoD (n = 46) (C,C'), myf5 (n = 35) (D,D') and e12 (n = 36) (E,E'). Decreased expression of cxcr4a was observed after misexpression of id2 (n = 27) (F,F'). Black arrows indicate sites of effects. Embryos are carefully aligned for cross section. (H,J,L,N,P) Transverse sections at the level of somites. (H',J',L',N',P) Fluorescein-Dextran to indicate location and proper one-sided injection. (H",J",L",N",P") DAPI staining. (H"',J"',L"',N"',P"') Composite images of bright-field and fluorescent images indicate exact site of effect. An increase of cxcr4a transcript after misexpression of myoD (J), myf5 (L), E12 (N) and decrease after misexpression of id2 (P). White dotted lines demarcate area of staining while black dotted lines define where relative intensities of staining were measured. (G,I,K,M,O) Graphs from Image-Pro Plus software. Control, G. Changes of relative intensity, indicated by peaks in I,K,M and O respectively. EXPRESSION / LABELING:
|
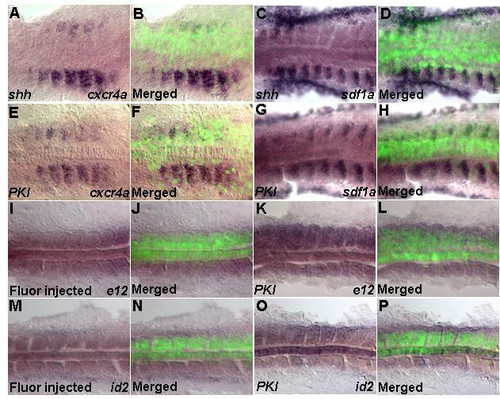
Shh signaling represses expression of cxcr4a and sdf1a. Dorsal views (A-P). Ectopic overexpression of shh mRNA (100 pg) and PKI mRNA (100 pg). Embryos between 11–14 h were analyzed. (A-H) Overexpression of shh (A-D) or PKI (E-H) in the somite represses expression of cxcr4a and sdf1a. (I,J; M,N) Control for e12 and id2 transcription by fluorescent-dextran injection. (K,L;O,P) Overexpression of PKI increases transcription of e12 and id2. |
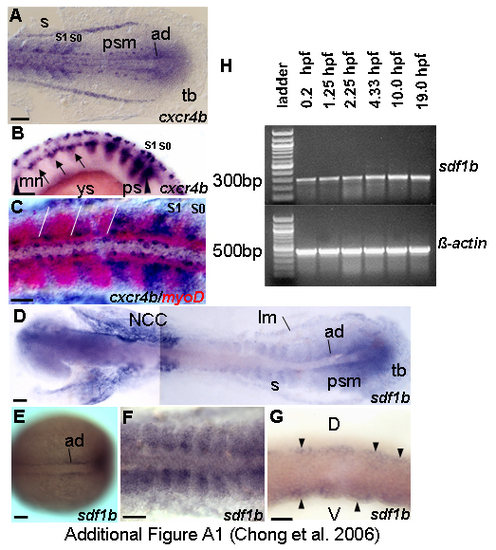
The dynamic expression of cxcr4b and sdf1b during segmentation. Dorsal views (A,C-F) and lateral views (B,G). (A) cxcr4b is expressed in the tailbud region, adaxial cells, paraxial mesoderm, 13.5 h. (B) Expression of cxcr4b is reduced as differentiation proceed, strong expression is in forming and newly formed somites, 18 h. (C) Two color in situ for myoD (red) and cxcr4b (blue) reveals partial overlapping expression of cxcr4b and myoD, 14 h. White lines demarcate the somite boundaries. (E) sdf1b transcription starts early in the adaxial cells, 10 h. (D,F) Expression in somites is relatively weak; some part of adaxial and paraxial mesoderm express sdf1b at 14 h and 14.5 h respectively. (G) sdf1b transcription localizes in dorsal and ventral regions of somites as indicated by black arrowheads, 16.5 h. (H) Reverse transcription (RT)-PCR detects continuous presence of transcript of sdf1b during early development. sdf1b transcript is present before mid-blastula transition (MBT). To confirm results, products were sequenced. β-actin was used as positive control. -RT control using β-actin primers without addition of reverse transcriptase, no band was detected (data not shown). Abbreviations: ad – adaxial cells; d – dorsal; lm – lateral mesoderm; mn – motoneurons; ncc – neural crest cells; ps – presomite; psm – presomitic mesoderm; s – somite; S0 – forming somite; S1 – newly formed somite; tb – tailbud; v – ventral; ys – yolk sac. Scale bars = 50 μm. EXPRESSION / LABELING:
|
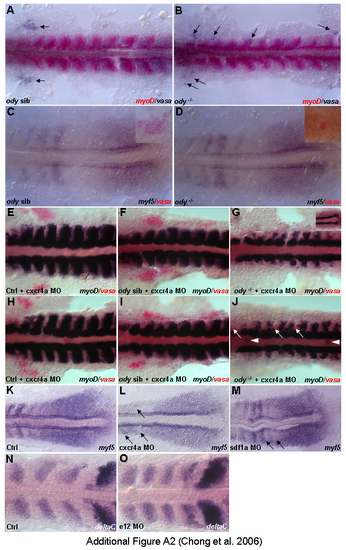
Control experiments. Dorsal views (A-O). (A,B) Embryos double stained with myoD (red) and vasa (blue), 14 h. vasa riboprobe ensures that ody-/- was correctly identified since mutant embryos appear phenotypically normal. No significant change in myoD was observed in ody-/-. Arrows indicate the cluster of primodial germ cells (PGCs). (C,D) Embryos double stained with myf5 (blue) and vasa (red), 14 h. No significant change was detected in the paraxial mesoderm. Insets showing normal cluster of PGCs in ody sib and PGCs were found along midline in head region of ody-/-. (E-J) Two sets of experiment (E-G and H-J) demonstrating redundancy in function between cxcr4a and cxcr4b. A lower dosage of cxcr4a MO was used to obtain normal myoD staining but disrupted myoD in paraxial mesoderm in ody -/-. vasa (red) helps to identify ody -/-. White arrowheads in J indicate ectopic expression of myoD. (K-M) cxcr4a and sdf1a morphants show normal transcription of myf5 in tailbud domain, 14 h. (N,O) A representative e12 morphant stained with deltaC as a control for cxcr4a and sdf1a transcriptional analysis, 14 hpf. Somites are formed in these morphants and notch pathway is unaffected. EXPRESSION / LABELING:
PHENOTYPE:
|
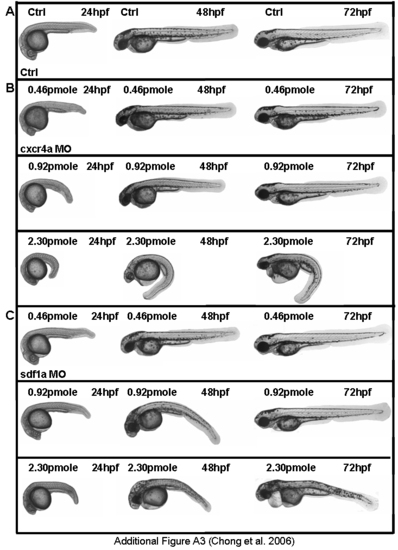
Range of phenotypes in morphants. (A) Control. (B) cxcr4a morphants. (C) sdf1a morphants. cxcr4a and sdf1a MOs act in a dosage dependent manner. |
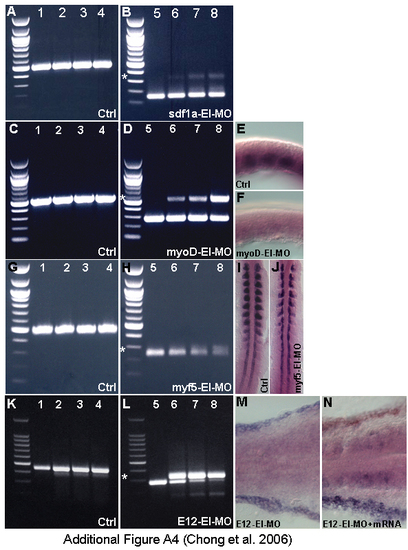
Efficiency of splice site MOs. (A,C,G,K) β-actin primers used in +RT control. Splice site MOs inhibit splicing in sdf1a (B), myoD (D), myf5 with degradation (H) and e12 (L). Total RNA from control (lane1,5), 0.46 pmole/embryo (lane2,6), 0.92 pmole/embryo (lane 3,7), 2.3 pmole/embryo(lane4,8). Splice product sizes are indicated by white asterisks. (E,F) mylz2 riboprobe staining on control (n = 20/20) and myoD-EI morphant (n = 19/20) respectively [96]. (I,J) myogenin riboprobe staining on control (n = 20/20) and myf5-EI morphant (n = 18/20) respectively [97]. (M,N) sdf1a riboprobe staining on E12-EI morphant (n = 20/20)and morphant rescued with e12 mRNA (n = 10/16). EXPRESSION / LABELING:
|
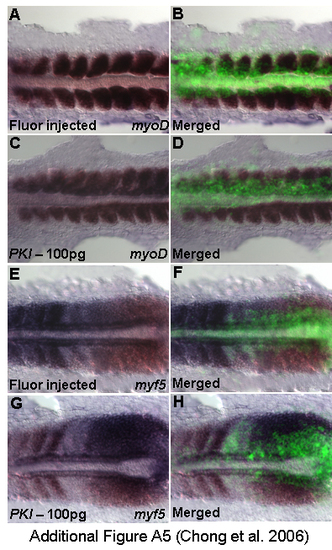
Control experiments for in vivo effects of PKI on the induction of myogenic transcription. (A,B) Fluorescent-dextran injected embryos stained with myoD (n = 10), 14 h. (C,D) PKI injected embryos with robust myoD (n = 10), 14 h. (E,F) Fluorescent-dextran injected embryos stained with myf5 (n = 10), 14 h. (G,H) PKI injected embryos with augmented myf5 (n = 10), 14 h. EXPRESSION / LABELING:
|