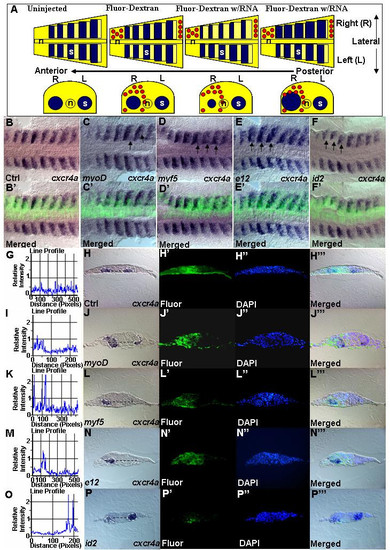
MRFs and co-factors are required for cxcr4a transcription. (A) Schematic showing the outcome of two-cell stage injection. Blue represents a signal of cxcr4a in situ hybridization. Red circles represent fluorescein-dextran on injected side. In control uninjected embryos, transcription analysis with antisense probes will appear symmetrical on left and right sides of flat mount zebrafish embryo. Staining will not differ significantly between left and right sides in both uninjected embryos and control fluorescein-dextran injected embryos. All comparisons were done between opposing pairs of somites. For each set of experiment, a minimum of three embryos between 11–14 h were analyzed using cryosectioning. The uninjected side acts as the internal control. Embryos stained with cxcr4a riboprobe. (B-F') Dorsal views. (B'-F') Composite images of the bright-field and fluorescent image showing one sided distribution of mRNA expressing cells. Increased level of cxcr4a transcript can be seen after misexpression of myoD (n = 46) (C,C'), myf5 (n = 35) (D,D') and e12 (n = 36) (E,E'). Decreased expression of cxcr4a was observed after misexpression of id2 (n = 27) (F,F'). Black arrows indicate sites of effects. Embryos are carefully aligned for cross section. (H,J,L,N,P) Transverse sections at the level of somites. (H',J',L',N',P) Fluorescein-Dextran to indicate location and proper one-sided injection. (H",J",L",N",P") DAPI staining. (H"',J"',L"',N"',P"') Composite images of bright-field and fluorescent images indicate exact site of effect. An increase of cxcr4a transcript after misexpression of myoD (J), myf5 (L), E12 (N) and decrease after misexpression of id2 (P). White dotted lines demarcate area of staining while black dotted lines define where relative intensities of staining were measured. (G,I,K,M,O) Graphs from Image-Pro Plus software. Control, G. Changes of relative intensity, indicated by peaks in I,K,M and O respectively.
|
