
- Title
-
Functional Modulation of Cardiac Form through Regionally Confined Cell Shape Changes
- Authors
- Auman, H.J., Coleman, H., Riley, H.E., Olale, F., Tsai, H.J., and Yelon, D.
- Source
- Full text @ PLoS Biol.
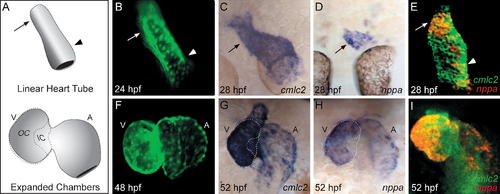
nppa Expression Distinguishes the OC and IC of the Zebrafish Ventricle. (A) Cartoon of the zebrafish LHT (24–28 hpf) and expanded chamber (48–58 hpf) stages. The expanded ventricle (V) and atrium (A) each exhibit an OC and IC, as outlined on the ventricle. (B and F) Live images of embryos expressing Tg(cmlc2:egfp) in the LHT (dorsal view) and in the expanded chambers (frontal view). The arterial and venous halves of the LHT will form the ventricle and atrium, respectively [51]. Specific regions of the LHT will expand to create the OC of the ventricle ([B] arrow) and the OC of the atrium ([B] arrowhead). (C–E and G–I) Whole-mount in situ hybridization comparing expression of the myocardial gene cardiac myosin light chain 2 (cmlc2) with expression of nppa at LHT ([C–E] dorsal view) and expanded chamber ([G–I] frontal view) stages. (E and I) Fluorescent in situ hybridization depicts cmlc2 expression in green and nppa expression in red. In the LHT, nppa expression is regionally restricted to the future OC of the ventricle ([C–E] arrow); at this stage, faint expression is also detectable in the future OC of the atrium ([E] arrowhead). In the expanded chambers, nppa is expressed in the OC, but absent from the IC and atrioventricular canal (G–I). |
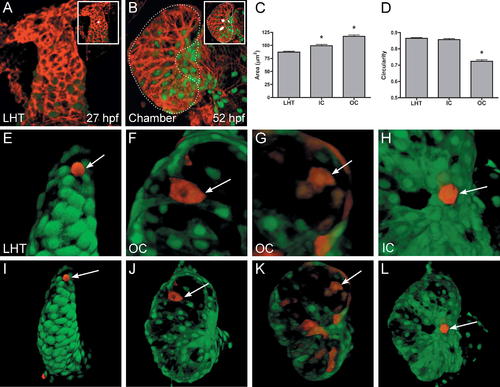
Regionally Confined Cell Shape Changes Accompany Chamber Emergence. (A and B) Phalloidin staining (red) of wild-type hearts expressing Tg(cmlc2:egfp). Insets show representative cell shapes filled in white. (C and D) Bar graphs depict surface area and circularity measurements of LHT, IC, and OC cells. Bar height indicates the mean value of a dataset, and error bars indicate standard error. An asterisk indicates statistically significant differences compared to LHT data (p < 0.0001). See Materials and Methods for details of morphometric analyses. (C) Surface area measurements in fixed samples demonstrate that IC and OC cells are significantly larger than LHT cells. (D) Cell shape assessments in fixed samples demonstrate that OC cells are significantly elongated relative to the more circular LHT and IC cells. (E–L) Confocal projections of live Tg(cmlc2:egfp)-expressing hearts that exhibit mosaic expression of Tg(cmlc2:dsredt4). Arrows point to representative cells expressing both dsredt4 and egfp. Three-dimensional assessment of cell morphologies in live embryos confirms that LHT (E and I) and IC (H and L) cells are relatively cuboidal, whereas OC cells are flattened and elongated (F, G, J, and K). OC cells are typically oriented with their long axes perpendicular to the arterial–venous axis (F and J), although some examples do not exhibit obvious orientation (G and K). |
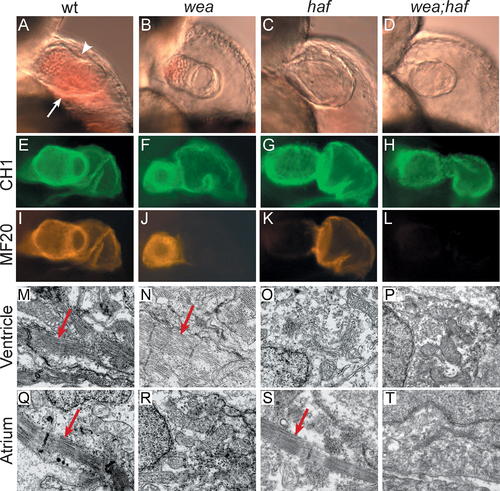
Mutation of wea and haf Cause Chamber-Specific Contractility Defects. Analysis of wea, haf, and wea;haf double mutants at 48 hpf reveals abnormal ventricular morphology and chamber-specific sarcomere deficiencies. hafsk24 and weam58 are recessive mutations that independently segregate; intercrosses of fish doubly heterozygous for wea and haf produce a 9:3:3:1 ratio of wild type:wea:haf:wea;haf. (A–D) Lateral views of live embryos, anterior to the top, ventricular plane of focus. (A) The wild-type (wt) ventricle possesses distinct concave (arrowhead) and convex (arrow) curvatures. (B) In contrast, the wea ventricle appears small, with less-pronounced curvatures. (C) The haf ventricle appears large and distended, with a notable separation between the myocardium and endocardium. (D) The wea;haf ventricle is small, with relatively spherical contours. (E–L) Whole-mount immunofluorescence detecting tropomyosin (CH1; green) and sarcomeric myosin heavy chain (MF20; red). Lateral views, ventricle to the left. Tropomyosin is present in all cardiomyocytes (E–H). In contrast, myosin heavy chain appears absent from the wea atrium (J), haf ventricle (K), and both chambers of the wea;haf heart (L). (M–T) Ultrastructural analysis of cardiomyocytes by transmission electron microscopy. Normal myofibril arrays (arrows) are present in wt chambers (M and Q), in the wea ventricle (N), and in the haf atrium (S). Organized myofibril arrays are absent from the wea atrium (R), the haf ventricle (O), and both chambers of the wea;haf heart (P and T). PHENOTYPE:
|
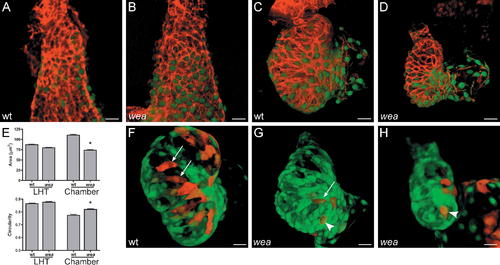
Cardiomyocytes in the wea Mutant Ventricle Retain Small Surface Areas and Fail to Elongate Normally. (A–D) Phalloidin staining (red) of wild-type (wt) and wea mutant hearts expressing Tg(cmlc2:egfp) at LHT (A and B) and expanded chamber (C and D) stages. (E) Bar graphs depict surface area and circularity measurements, as in Figure 2. An asterisk indicates statistically significant differences compared to wt data (p < 0.0001). Since chamber curvatures are less distinct in wea mutants than they are in wt embryos, OC and IC data are pooled for comparison of cell size and shape at expanded chamber stages. Analysis of fixed samples demonstrates that wea cell surfaces are significantly smaller and more circular at chamber stages in comparison to wt. The trend toward smaller cell size in wea is also apparent at LHT stages (p < 0.05). (F–H) Confocal projections of live hearts, as in Figure 2, confirm the contrast between cell morphologies in wt and wea mutant ventricles. The wt OC typically contains elongated cells ([F] arrows), whereas wea OC cells have a smaller and less spread-out appearance, even when elongated ([G] arrow), and are frequently cuboidal ([G and H] arrowheads). Size bar represents 20 μm. |
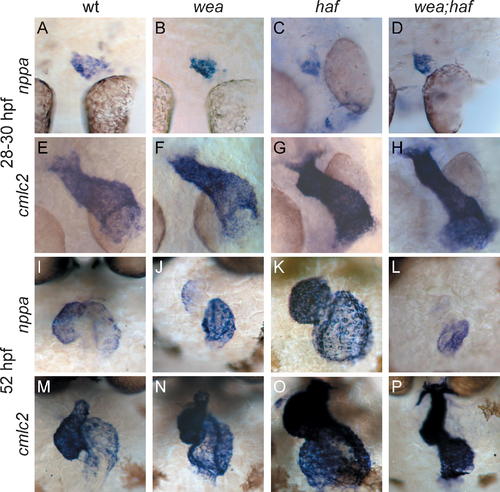
Regionalization of nppa Expression in wea, haf, and wea;haf Mutants Is Normal at LHT Stages but Abnormal at Expanded Chamber Stages. Whole-mount in situ hybridization of nppa (A–D and I–L) compared to cmlc2 (E–H and M–P). (A–H) Dorsal views, ventricle to the top, at LHT stages. (A, B, E, and F) are 28 hpf; (C, D, G, and H) are 30 hpf. Although initiation of nppa expression is delayed in haf (C) and wea;haf (D) mutants, the nppa expression domain is normal in the wea (B), haf (C), and wea;haf (D) LHT. (I–P) Frontal views, ventricle to the left, at expanded chamber stages (52 hpf). (J) Regionalized nppa expression is not maintained in the wea mutant ventricle; instead, nppa expression in the wea ventricle is fainter and in a smaller domain than in wild type (wt) (I). (K) In the haf mutant ventricle, intense nppa expression is found throughout the chamber, rather than being restricted to the OC. (L) The wea;haf double mutant ventricle exhibits weak and diffuse nppa expression. |
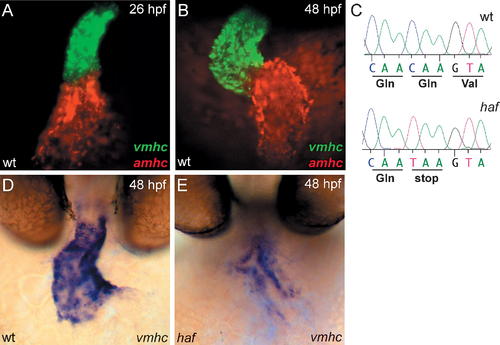
hafsk24 Is a Strong Loss of Function Allele of vmhc, a Ventricle-Specific Myosin Heavy Chain Gene with Expression Complementary to amhc. (A and B) Fluorescent in situ hybridization for vmhc (green) and amhc (red) in wild-type (wt) embryos at LHT ([A] 26 hpf, dorsal view) and expanded chamber ([B] 48 hpf, frontal view) stages. At all stages examined, vmhc is expressed in the ventricular myocardium [51]. In contrast, amhc expression is restricted to the atrial myocardium [28]. (C) Comparison of vmhc coding sequence in wt and hafsk24 embryos reveals a C to T transition at position 3,094 that results in a premature stop codon in hafsk24. (D and E) Whole-mount in situ hybridization depicts frontal view of vmhc expression in wt and haf at 48 hpf. vmhc expression is dramatically reduced in the haf mutant ventricle. |
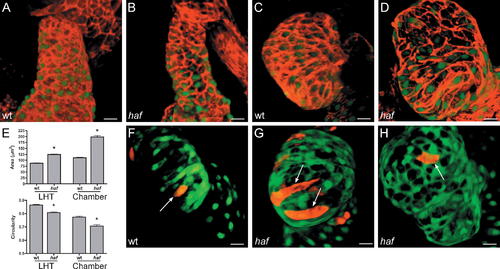
Cardiomyocyte Surfaces throughout the haf Ventricle Become Excessively Enlarged and Elongated. (A–D) Phalloidin staining (red) of wt and haf mutant hearts expressing Tg(cmlc2:egfp) at LHT (A and B) and expanded chamber (C and D) stages. (E) Bar graphs depict surface area and circularity measurements, as in Figure 2. An asterisk indicates statistically significant differences compared to wild-type (wt) data (p < 0.0001). The shape and size of haf cells are significantly different from those of wt cells; at both LHT and expanded chamber stages, haf cells are larger and more elongated. (F–H) Confocal projections of live hearts, as in Figure 2, confirm the abnormal size and shape of haf mutant cardiomyocytes in the expanded ventricle. haf cells ([G and H] arrows) are larger than their wt counterparts ([F] arrow) and can be greatly elongated (G). Size bar represents 20 μm. |
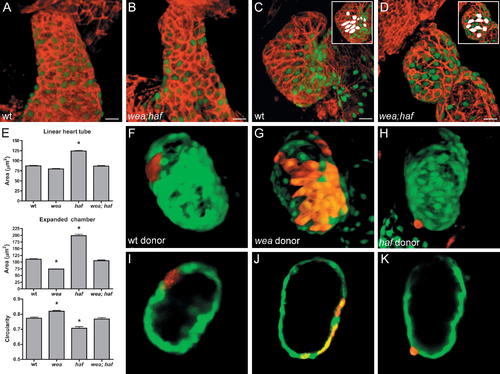
Cells Lacking Vmhc Assume Different Morphologies under Different Hemodynamic Conditions. (A–D) Phalloidin staining (red) of wild-type (wt) and wea;haf double mutant hearts expressing Tg(cmlc2:egfp) at LHT (A and B) and expanded chamber (C and D) stages. Insets highlight representative cell shapes in white. wea;haf cells are irregularly shaped and lack apparent organization or alignment. (E) Bar graphs depict surface area and circularity measurements, as in Figure 2. An asterisk indicates statistically significant differences compared to wt data (p < 0.0001). Despite their irregular organization and morphology, wea;haf ventricular cells exhibit a size and circularity range similar to that of wt cells and distinct from that of wea or haf. Notably, wea;haf ventricular cells enlarge more than wea cells do (p < 0.0001), even though wea;haf mutants lack blood flow. Also, wea;haf cell morphologies are not as extreme in size (p < 0.0001) or elongation (p < 0.001) as haf cell morphologies, even though wea;haf mutant cells lack Vmhc. (F–K) Chimeric ventricles resulting from transplantation of rhodamine dextran-labeled blastomeres into wt hosts expressing Tg(cmlc2:egfp). Optical sections of (F, G, and H) are shown in (I, J, and K), respectively. (F, G, I, and J) Cells from wt or wea donors integrate normally within the wall of the wt host ventricle. (H and K) In contrast, cells from haf donors project abnormally from the ventricular wall and fail to maintain normal shape, indicating a cell-autonomous requirement for Vmhc in the maintenance of cardiomyocyte morphology. Size bar represents 20 μm. |