
Fig. 4
- ID
- ZDB-IMAGE-070815-4
- Publication
- Auman et al., 2007 - Functional Modulation of Cardiac Form through Regionally Confined Cell Shape Changes
- All Figures
- Figures for Auman et al., 2007
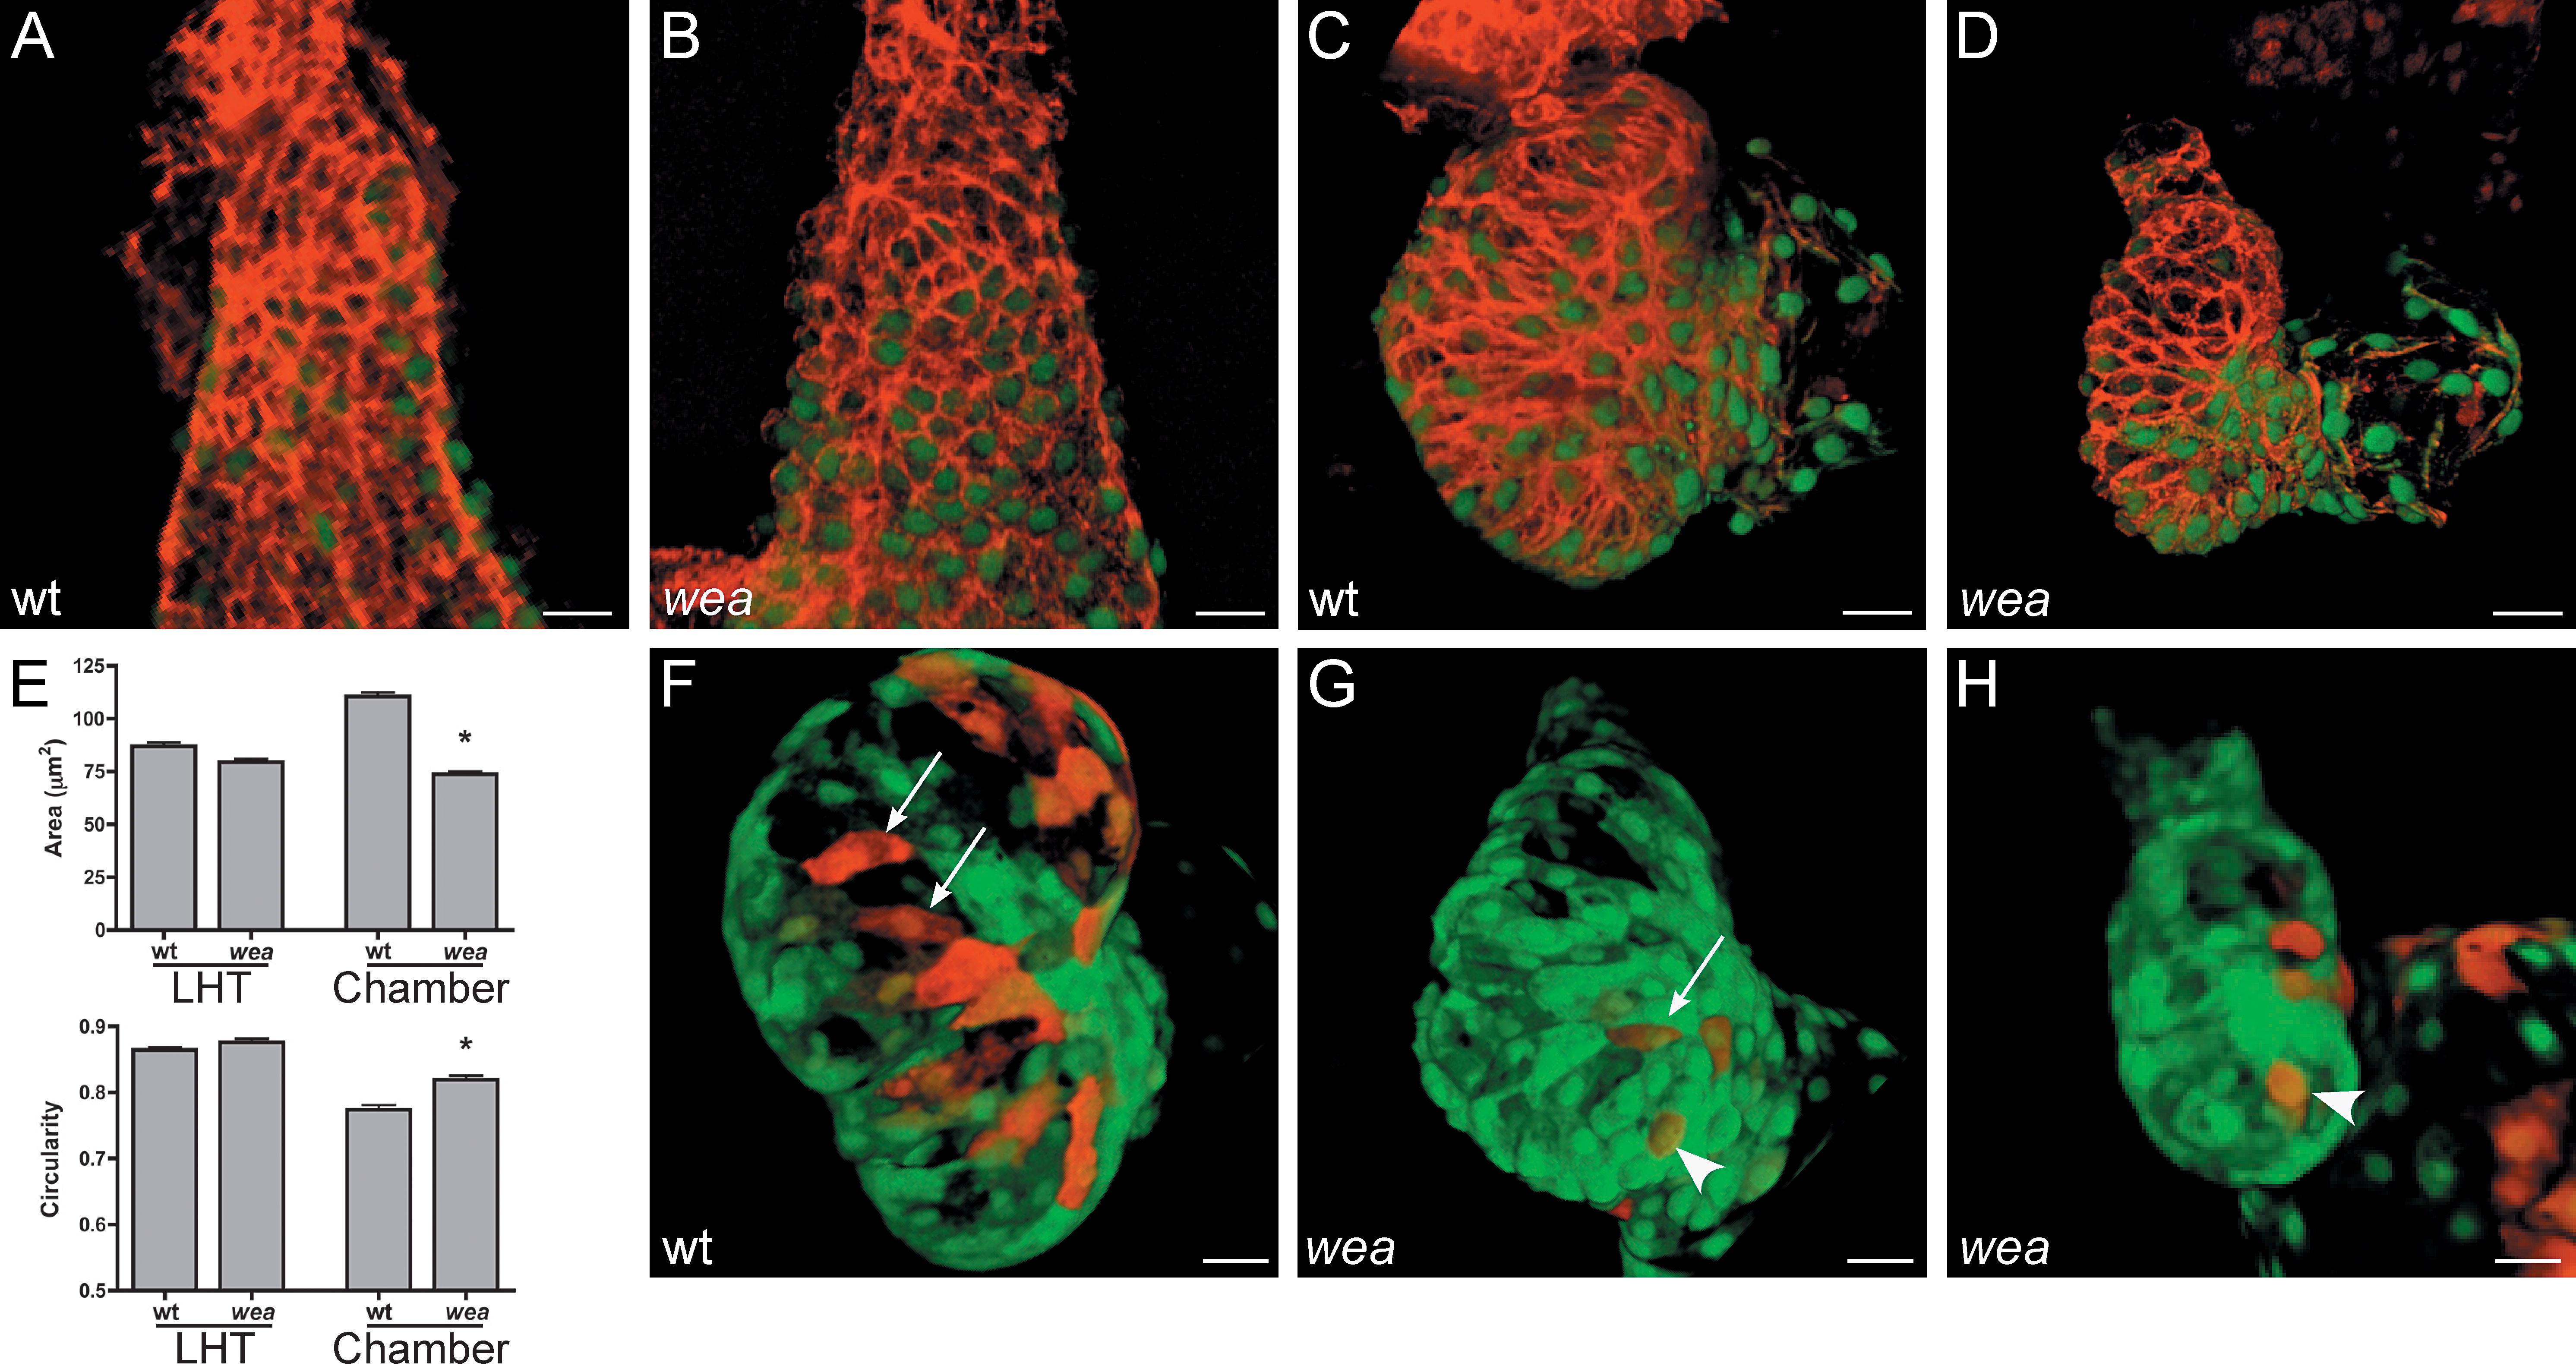
|
Fig. 4 Cardiomyocytes in the wea Mutant Ventricle Retain Small Surface Areas and Fail to Elongate Normally. (A–D) Phalloidin staining (red) of wild-type (wt) and wea mutant hearts expressing Tg(cmlc2:egfp) at LHT (A and B) and expanded chamber (C and D) stages. (E) Bar graphs depict surface area and circularity measurements, as in Figure 2. An asterisk indicates statistically significant differences compared to wt data (p < 0.0001). Since chamber curvatures are less distinct in wea mutants than they are in wt embryos, OC and IC data are pooled for comparison of cell size and shape at expanded chamber stages. Analysis of fixed samples demonstrates that wea cell surfaces are significantly smaller and more circular at chamber stages in comparison to wt. The trend toward smaller cell size in wea is also apparent at LHT stages (p < 0.05). (F–H) Confocal projections of live hearts, as in Figure 2, confirm the contrast between cell morphologies in wt and wea mutant ventricles. The wt OC typically contains elongated cells ([F] arrows), whereas wea OC cells have a smaller and less spread-out appearance, even when elongated ([G] arrow), and are frequently cuboidal ([G and H] arrowheads). Size bar represents 20 μm.