
Fig. 2
- ID
- ZDB-IMAGE-070815-2
- Publication
- Auman et al., 2007 - Functional Modulation of Cardiac Form through Regionally Confined Cell Shape Changes
- All Figures
- Figures for Auman et al., 2007
|
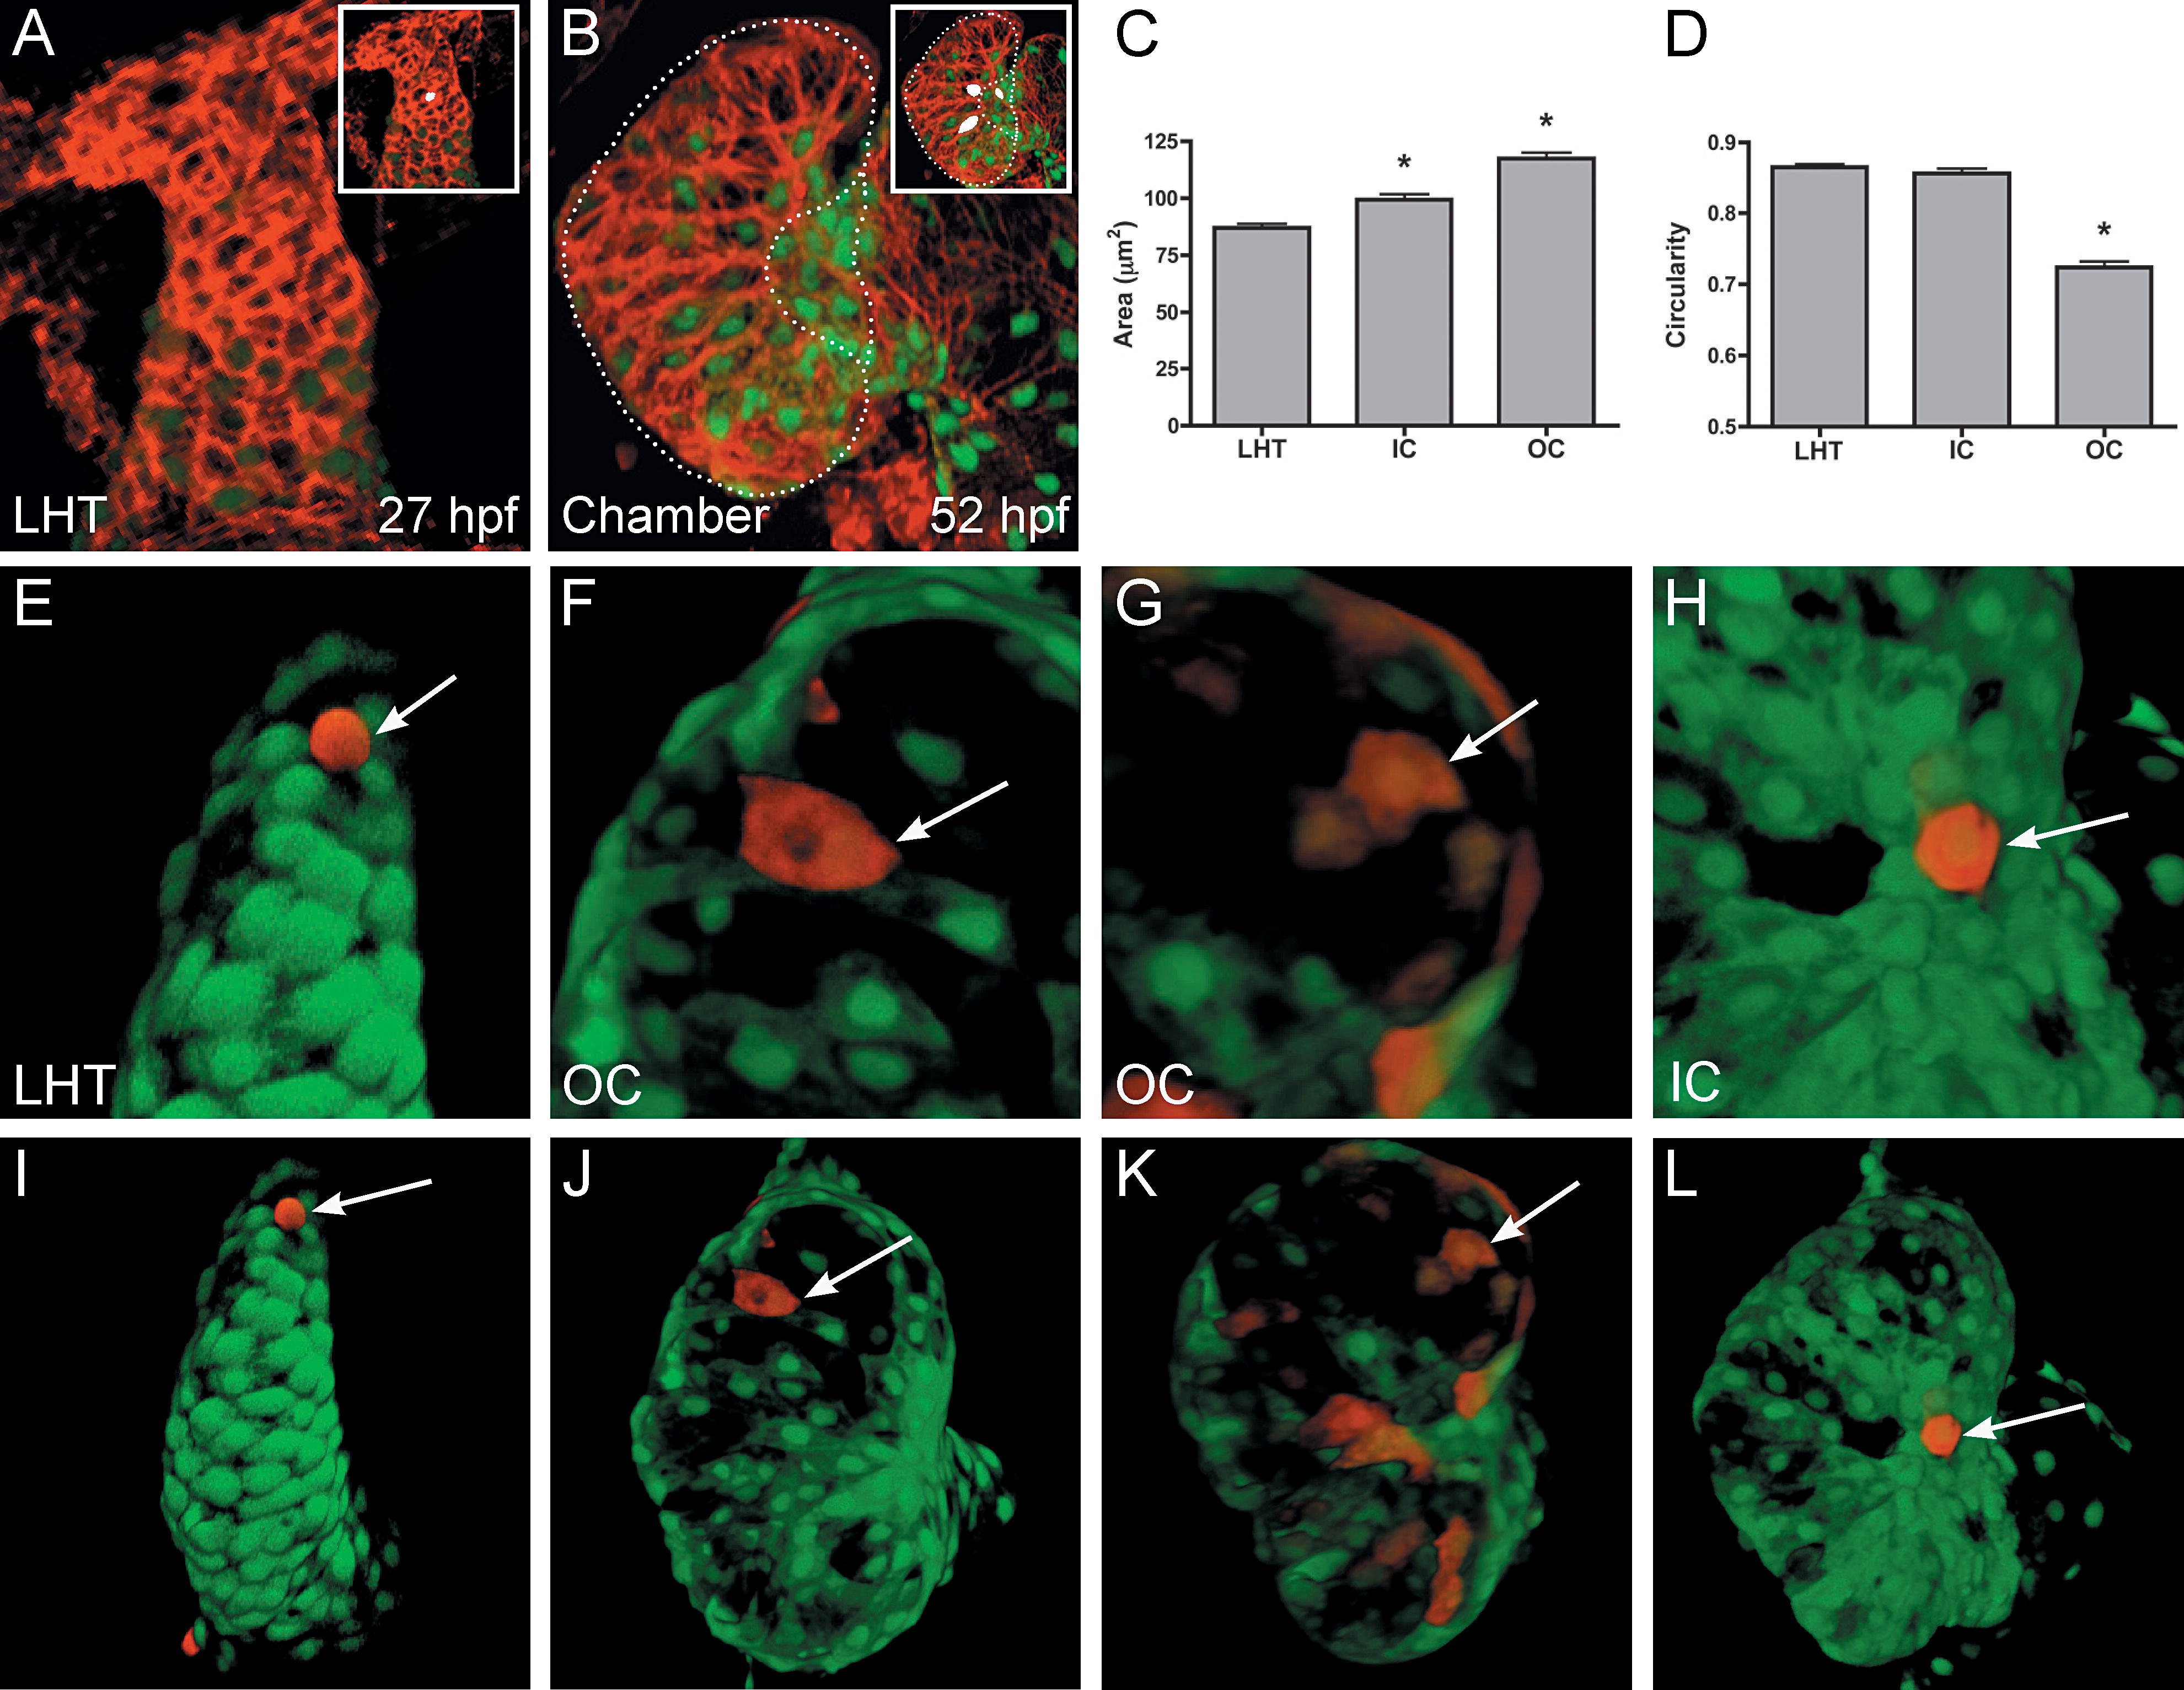
Fig. 2 Regionally Confined Cell Shape Changes Accompany Chamber Emergence. (A and B) Phalloidin staining (red) of wild-type hearts expressing Tg(cmlc2:egfp). Insets show representative cell shapes filled in white. (C and D) Bar graphs depict surface area and circularity measurements of LHT, IC, and OC cells. Bar height indicates the mean value of a dataset, and error bars indicate standard error. An asterisk indicates statistically significant differences compared to LHT data (p < 0.0001). See Materials and Methods for details of morphometric analyses. (C) Surface area measurements in fixed samples demonstrate that IC and OC cells are significantly larger than LHT cells. (D) Cell shape assessments in fixed samples demonstrate that OC cells are significantly elongated relative to the more circular LHT and IC cells. (E–L) Confocal projections of live Tg(cmlc2:egfp)-expressing hearts that exhibit mosaic expression of Tg(cmlc2:dsredt4). Arrows point to representative cells expressing both dsredt4 and egfp. Three-dimensional assessment of cell morphologies in live embryos confirms that LHT (E and I) and IC (H and L) cells are relatively cuboidal, whereas OC cells are flattened and elongated (F, G, J, and K). OC cells are typically oriented with their long axes perpendicular to the arterial–venous axis (F and J), although some examples do not exhibit obvious orientation (G and K).