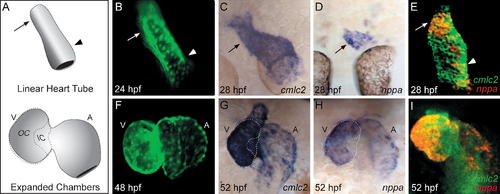
nppa Expression Distinguishes the OC and IC of the Zebrafish Ventricle. (A) Cartoon of the zebrafish LHT (24–28 hpf) and expanded chamber (48–58 hpf) stages. The expanded ventricle (V) and atrium (A) each exhibit an OC and IC, as outlined on the ventricle. (B and F) Live images of embryos expressing Tg(cmlc2:egfp) in the LHT (dorsal view) and in the expanded chambers (frontal view). The arterial and venous halves of the LHT will form the ventricle and atrium, respectively [51]. Specific regions of the LHT will expand to create the OC of the ventricle ([B] arrow) and the OC of the atrium ([B] arrowhead). (C–E and G–I) Whole-mount in situ hybridization comparing expression of the myocardial gene cardiac myosin light chain 2 (cmlc2) with expression of nppa at LHT ([C–E] dorsal view) and expanded chamber ([G–I] frontal view) stages. (E and I) Fluorescent in situ hybridization depicts cmlc2 expression in green and nppa expression in red. In the LHT, nppa expression is regionally restricted to the future OC of the ventricle ([C–E] arrow); at this stage, faint expression is also detectable in the future OC of the atrium ([E] arrowhead). In the expanded chambers, nppa is expressed in the OC, but absent from the IC and atrioventricular canal (G–I).
|
