
- Title
-
Discontinuous organization and specification of the lateral floor plate in zebrafish
- Authors
- Schafer, M., Kinzel, D., and Winkler, C.
- Source
- Full text @ Dev. Biol.
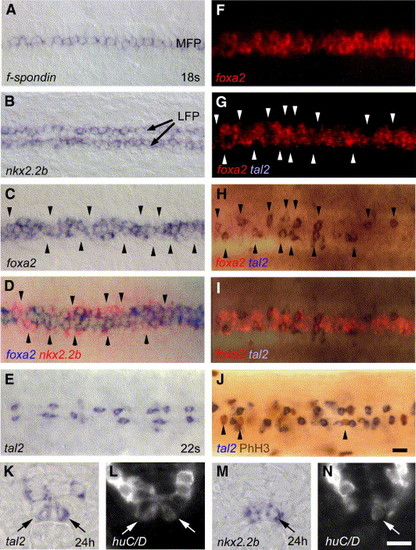
LFP cells show different expression profiles and identities. (A, B) Dorsal views of trunk regions showing homogenous expression of f-spondin in the MFP (A) and nkx2.2b in the LFP (B). (C) foxa2 is discontinuously expressed in the LFP, with regions of weak expression levels along the AP axis (indicated by arrowheads). (D) Overlay of a double in situ hybridization showing nkx2.2b (in red) that is strongly expressed within regions of weak foxa2 expression (in blue). In overlapping regions, nkx2.2b detection is quenched. (E) tal2 is expressed in single cells of the LFP that are discontinuously distributed along the AP axis. (F–I) Double in situ hybridization with tal2 (blue) and foxa2 (red). foxa2 analysis shows no significant difference in fluorescence detection when compared before (F) and after detection of tal2 (G). Expression of tal2 only (H) and overlay of tal2 with foxa2 (I) showing complementary localization of tal2 in regions of weak foxa2 expression. (J) PhH3 immunostaining (in brown) is only detected in LFP cells that do not express tal2 (in blue). Panels A–J are dorsal views of trunk at 18 to 22 s stage, anterior to the left. (K, L) tal2 expression in the LFP (indicated by arrow) partly co-localizes with the postmitotic neuronal marker huC/D at 24 hpf (arrows in L). (M, N) A subpopulation of nkx2.2b-expressing LFP cells (M) also expresses huC/D (arrow in N). The same transverse sections are shown for bright-field (K, M) and Cy3 fluorescence (L, N), respectively. LFP, lateral floor plate; MFP, medial floor plate. Scale bar: J, 10 μM; N, 5 μM. EXPRESSION / LABELING:
|

Two different cell populations alternate in the zebrafish ventral neural tube. (A, B) At 48 hpf, foxa2 is discontinuously expressed in cells adjacent to the MFP (A). tal2 expression is weakly detectable in single cells at 44 hpf (B). Arrowheads in panel (A) indicate regions with no detectable expression of foxa2. (C) sim1 is expressed in groups of cells located adjacent to the MFP, which are discontinuously distributed along the AP axis, similar to tal2 in panel B. (D, E) Some sim1-positive cells (in red in D and E) co-express tal2 (in blue in D, indicated by arrowheads). (F–G) sim1-expressing cells (F) are positive for the neuronal marker huC/D (G). The same transverse section is shown for bright-field (F) and Cy3 fluorescence (H). (H, I) GABA protein in wild-type (H) and gata-2 gene expression in gata-2:GFP transgenic embryos (I). Focal plane shows the most ventral cells of the neural tube and depicts Kolmer–Agdhur (KA) neurons and ventral interneurons (VI), respectively, in the ventral-most domain (also shown in transverse section in panel L). Note similar expression of tal2 (B), sim1 (C), GABA (H) and gata-2 (I). Panels A–E and H, I are dorsal views of trunk, anterior to the left. (J–N) Transverse sections showing co-expression of sim1 (J), tal2 (in blue) and sim1 (in red; K), GABA (L), foxa2 (M) and nkx2.2b (N) in the ventral neural tube. (O, P) Expression of olig2 in the motoneuronal domain (M) and isl2 in differentiated motoneurons (N) is located adjacent to markers detected in panels J–N. (Q) Model of the zebrafish ventral neural tube during early neurogenesis in which non-neuronal LFP (foxa2+, nkx2.2b+) and p3 neuronal progenitor cells (tal2+, nkx2.2b+) alternate along the AP axis in cells adjacent to the MFP. Panels F, G and J–P are transverse sections of middle trunk regions. VI, ventral interneurons; KA, Kolmer–Agdhur neurons; MN, motoneurons; VeLD, ventral lateral distal neurons. Scale bars: E,G 5 μM; I,P 10 μM. |
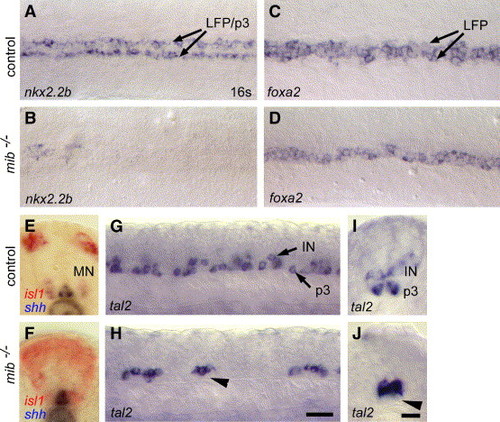
Delta-Notch signaling is required for LFP and p3 neuronal progenitor cell development. (A–D) nkx2.2b (A, B) and foxa2 (C, D) expression in wild-type control (A, C) and mib−/− embryos (B, D). In mib−/− mutants, nkx2.2b and foxa2 are both strongly reduced in the LFP and p3 neuronal progenitor cells in comparison to control (for nkx2.2b in n = 12 (22%) embryos from a clutch of 55 embryos obtained from identified, heterozygous carriers; n = 5/19, 26% for foxa2, n = 8/34, 24% for tal2). Only single cells are detectable. (E, F) Expression of isl1 (in red) and shh (in blue) in wild-type (E) and mib−/− mutants (F). In control embryos, isl1 is expressed in primary motor and sensory neurons (E). In mib−/−, isl1 is strongly expanded and is located in cells directly adjacent to the MFP. (G–J) tal2 expression in wild-type (G, I) and mib−/− (H, J) mutants. In mib−/− mutants, tal2 expression is strongly reduced in the most ventral cells (arrowhead marks region with absent p3 cells). Panels A–D are dorsal views, panels E, F, I, J are transverse sections and panels G, J are lateral views of embryos at the 16- to 20 s stage. Scale bars: H, 20 μM; J, 10 μM. EXPRESSION / LABELING:
PHENOTYPE:
|

Differential regulation of LFP and p3 neuronal progenitor cells in hedgehog mutants. (A–C) In wild-type control embryos, nkx2.2b is homogenously expressed in LFP and p3 neuronal progenitor cells along the AP axis (A). nkx2.2b expression is reduced to single cells in dtr+/− (detour, gli1) mutants (in n = 15 (56%) out of a clutch of 27 embryos obtained from identified carriers; B) and completely absent in dtr−/− (n = 7/27, 26%; C). Similar results were obtained in yot mutants (yot+/−, n = 22/40, 55%; yot−/−, n = 11/40, 28%). (D) foxa2 is expressed in the MFP and LFP cells in wt embryos (D). In yot+/− (you-too, gli2; E) and yot−/− embryos (F), foxa2 is only detectable in the MFP (n = 23/34, 68%). The same was observed in dtr+/− and dtr−/− mutants (n = 11/18, 61%). (G–I) Identification of homozygous and heterozygous yot mutants. In wild-type embryos, eng2a is expressed in muscle pioneer cells (MPC; G). In yot+/− embryos, where foxa2 expression is lost in the LFP, expression of eng2a is normal (H). yot−/− embryos, in contrast, lack both, foxa2 in the LFP, as well as eng2a in the trunk (I). (J, K) Transverse sections of middle trunk regions. In wt and yot+/− embryos, tal2 is expressed in the p3 neuronal progenitor cells and in dorsally located interneurons (IN) within the ventral neural tube (J). yot−/− embryos lack tal2 expression in p3 neuronal cells, expression in more dorsally located interneurons is unaffected (n = 6/26, 23%; K). Scale bars: F, K, 10 μM. EXPRESSION / LABELING:
PHENOTYPE:
|
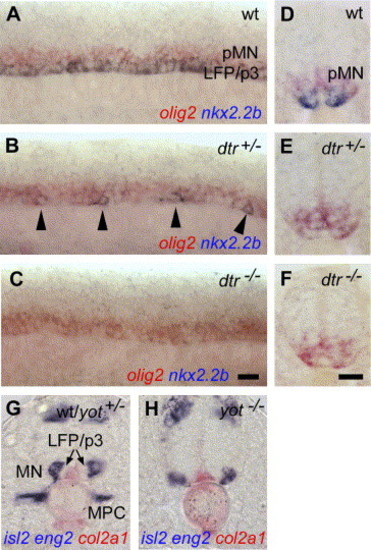
The motoneuronal domain is ventrally expanded in hedgehog mutants. (A–F) Expression of nkx2.2b (blue) and olig2 (red) in lateral view of trunk regions (A–C) and transverse sections (D–F). In wt embryos, nkx2.2b is expressed in LFP and p3 neuronal progenitor cells, olig2 is expressed in the motoneuronal domain (A, D). Olig2 expression is ventrally expanded in regions with no nkx2.2b in dtr+/− (E; n = 35 out of a clutch of 71 embryos obtained from mutant carriers, 49%) or along the entire axis in dtr−/− embryos (n = 17/71, 24%). The section shown in panel (E) was made in a region between remaining nkx2.2b expression. (G, H) Differentiated motoneurons expressing isl2 (in blue) are formed within the lateral motoneuronal domain in wt and yot+/− embryos (n = 16/22, 73%; G). The same position of isl2 is observed in yot−/− (n = 6/22, 27%). Most notably, no expression in cells neighboring the MFP expressing col2A1 (in red) are found (H). Homozygous yot embryos were identified by loss of eng2 (in blue) in muscle pioneer cells (MPC). Panels A–C are lateral views of trunk, anterior to the left. Panels D–H are transverse sections of middle trunk. MPC, muscle pioneer cells. Scale bars: C, F, 10 μM. EXPRESSION / LABELING:
PHENOTYPE:
|
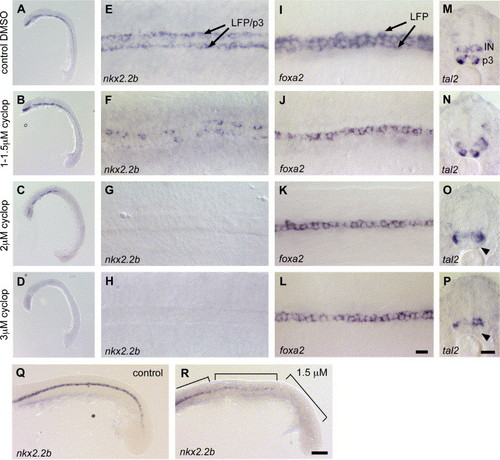
Dose-dependent effects of cyclopamine treatment on specification of LFP and p3 neuronal progenitor cells. (A–H) nkx2.2b expression in embryos treated with DMSO (A, E), 1–1.5 μM (B, F), 2 μM (C, G) and 3 μM (D, H) cyclopamine. (A, E) Embryos treated with DMSO show no effects on nkx2.2b expression. (B, F) 1–1.5 μM cyclopamine has no effect on head expression (B), but leads to discontinuous expression in the trunk (F; n = 68/123, 55%). (C, G) At 2 μM cyclopamine, nkx2.2b expression is reduced in the head (C) and completely absent in the trunk (G; n = 18/22, 82%). (D, H) Treatment with 3 μM cyclopamine blocks nkx2.2b expression in the entire embryo (n = 17/19, 89%). (I–L) Expression of foxa2 in embryos treated with DMSO (I), 1–1.5 μM (J), 2 μM (K) 3 μM cyclopamine (L). foxa2 is absent in the LFP and only detectable in the MFP in embryos treated with 1 μM cyclopamine or higher (J–L; n = 27/40, 67% for 1–1.5 μM), when compared to the DMSO control (I). (M–P) tal2 expression in embryos incubated with DMSO (M), 1–1.5 μM (N), 2 μM (O) and 3 μM cyclopamine (P). Expression of tal2 is not affected in embryos treated with 1–1.5 μM cyclopamine (M; n = 51/73, 70%), when compared to the DMSO control (N). Only higher concentrations of 2 μM (O) and 3 μM cyclopamine (P) lead to a loss of tal2 in p3 neuronal cells (indicated by arrowhead). (Q, R) nkx2.2b expression in DMSO control (Q) and 1.5 μM cyclopamine-treated embryos, lateral view (R). Embryos treated with 1–1.5 μM cyclopamine have patchy nkx2.2b expression in the middle trunk regions. In the posterior trunk, nkx2.2b expression is completely blocked. Regions with different degrees of nkx2.2b repression are indicated by boxes. Panels A–D and Q, R are lateral views of embryos in overview and trunk and tail regions respectively, anterior is to the left, panels E–L are dorsal view on trunk regions, anterior to the left, panels M–P are transverse section of middle trunk region. IN, interneurons. Scale bars: L, P, 10 μM; R, 50 μM. EXPRESSION / LABELING:
|
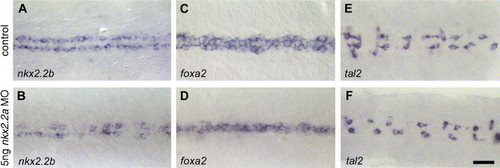
Knock-down of nkx2.2a interferes with LFP formation. (A, B) nkx2.2a morpholino injected embryos show reduction of nkx2.2b expression to single cells (B; for details, see text). (C–F) The LFP marker foxa2 is almost completely repressed in the LFP after nkx2.2a morpholino knock-down (D), while expression of tal2 in p3 neuronal progenitor cells is not affected (F). All pictures are dorsal views with anterior to the left. Scale bar in panel F is 20 μM. EXPRESSION / LABELING:
PHENOTYPE:
|
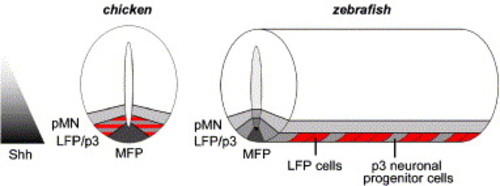
Schematic model of ventral neural tube organization during early neurogenesis in chicken and zebrafish. In chicken, non-neuronal LFP and p3 neuronal progenitor cell markers overlap in the domain between MFP and motoneuron progenitors (pMN). In zebrafish, LFP cells (in red) and p3 neuronal progenitor cells (in grey) alternate along the AP axis within this domain. During early embryonic development, distinct domains of cells that require different levels of Shh activity are generated along the DV axis of the vertebrate neural tube. In zebrafish, LFP and p3 neuronal progenitor cells, which are positioned at the same level along the DV axis, require different levels of HH activity. Note that MFP, LFP and neural progenitor domains are several cells wide in chicken, while in zebrafish MFP and LFP are only one cell in width and the pMN domain is two to three cells wide. |
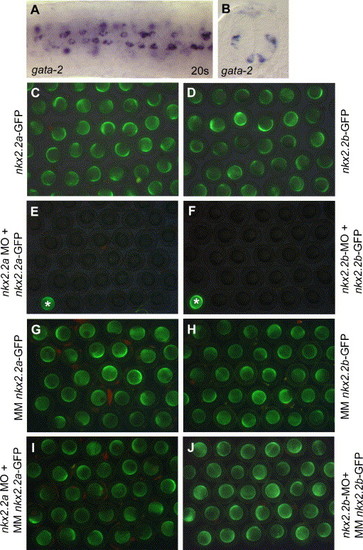
(A,B) Expression of gata-2 in the zebrafish neural tube. At the 20-s stage, gata-2 is expressed in single cells of the ventral neural tube, as shown in (A) in dorsal view of trunk region. These cells are irregularly distributed along the AP axis, similar to tal2-positive cells (Fig. 1E) and located between MFP and motoneuronal domain (B). gata-2 is also expressed in cells located more dorsally within the neural tube (B). (C–J) Control experiment for nkx2.2a and nkx2.2b morpholino activity and specificity. To test the functionality of the nkx2.2a and nkx2.2b morpholino oligos, the target binding sequences of each morpholino were cloned in front of the GFP open reading frame in an RNA expression vector. Capped mRNA of nkx2.2a-GFP or nkx2.2b-GFP was injected into 2 to 4-cell stage embryos. This resulted in strong GFP expression in nkx2.2a-GFP RNA (A) and nkx2.2b-GFP RNA (B) injected embryos. In the same experiment, nkx2.2a or nkx2.2b morpholinos were injected into 1-cell stage embryos and the corresponding nkx2.2a-GFP RNA or nkx2.2b-GFP RNA was injected 20 to 30 minutes later into the same embryos, at the 2 to 4-cell stage. This resulted in a strong repression of GFP expression in nkx2.2a-GFP RNA and nkx2.2a morpholino coinjected embryos (E) as well as nkx2.2b-GFP RNA and nkx2.2b morpholino coinjected embryos (F). Embryos in the left bottom corner indicated with asterisk are injected with nkx2.2a-GFP RNA only (E) or nkx2.2b-GFP RNA only (F), to compare differences in GFP expression levels. These experiments show that the nkx2.2a and nkx2.2b morpholinos can both efficiently block translation of the target mRNA. To control the specificity of the nkx2.2a and nkx2.2b morpholinos, 5 mismatches were introduced into the target sequence of each morpholino before cloning them upstream of GFP in a RNA expression vector. Injection of RNA of MM nkx2.2a-GFP (G) and MM nkx2.2b-GFP (H) both resulted in strong expression of GFP. Injection of the nkx2.2a (I) or nkx2.2b morpholino (J) at the 1-cell stage and subsequent injection of mismatch GFP RNA in the same embryos at the 2 to 4-cell stage resulted in a similar strong expression of GFP. This shows that both morpholinos are not able to block translation of related sequences containing 5 mismatches or more. Therefore, both morpholinos are specific in binding of the RNA target sequence. EXPRESSION / LABELING:
|
Reprinted from Developmental Biology, 301(1), Schafer, M., Kinzel, D., and Winkler, C., Discontinuous organization and specification of the lateral floor plate in zebrafish, 117-129, Copyright (2007) with permission from Elsevier. Full text @ Dev. Biol.