
Fig. 6
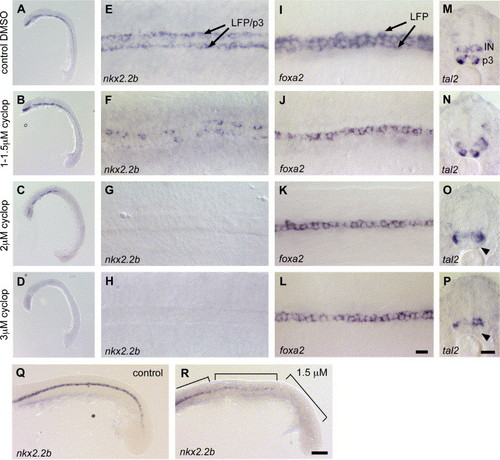
Dose-dependent effects of cyclopamine treatment on specification of LFP and p3 neuronal progenitor cells. (A–H) nkx2.2b expression in embryos treated with DMSO (A, E), 1–1.5 μM (B, F), 2 μM (C, G) and 3 μM (D, H) cyclopamine. (A, E) Embryos treated with DMSO show no effects on nkx2.2b expression. (B, F) 1–1.5 μM cyclopamine has no effect on head expression (B), but leads to discontinuous expression in the trunk (F; n = 68/123, 55%). (C, G) At 2 μM cyclopamine, nkx2.2b expression is reduced in the head (C) and completely absent in the trunk (G; n = 18/22, 82%). (D, H) Treatment with 3 μM cyclopamine blocks nkx2.2b expression in the entire embryo (n = 17/19, 89%). (I–L) Expression of foxa2 in embryos treated with DMSO (I), 1–1.5 μM (J), 2 μM (K) 3 μM cyclopamine (L). foxa2 is absent in the LFP and only detectable in the MFP in embryos treated with 1 μM cyclopamine or higher (J–L; n = 27/40, 67% for 1–1.5 μM), when compared to the DMSO control (I). (M–P) tal2 expression in embryos incubated with DMSO (M), 1–1.5 μM (N), 2 μM (O) and 3 μM cyclopamine (P). Expression of tal2 is not affected in embryos treated with 1–1.5 μM cyclopamine (M; n = 51/73, 70%), when compared to the DMSO control (N). Only higher concentrations of 2 μM (O) and 3 μM cyclopamine (P) lead to a loss of tal2 in p3 neuronal cells (indicated by arrowhead). (Q, R) nkx2.2b expression in DMSO control (Q) and 1.5 μM cyclopamine-treated embryos, lateral view (R). Embryos treated with 1–1.5 μM cyclopamine have patchy nkx2.2b expression in the middle trunk regions. In the posterior trunk, nkx2.2b expression is completely blocked. Regions with different degrees of nkx2.2b repression are indicated by boxes. Panels A–D and Q, R are lateral views of embryos in overview and trunk and tail regions respectively, anterior is to the left, panels E–L are dorsal view on trunk regions, anterior to the left, panels M–P are transverse section of middle trunk region. IN, interneurons. Scale bars: L, P, 10 μM; R, 50 μM. |
| Genes: | |
|---|---|
| Fish: | |
| Condition: | |
| Anatomical Terms: | |
| Stage: | 14-19 somites |
Reprinted from Developmental Biology, 301(1), Schafer, M., Kinzel, D., and Winkler, C., Discontinuous organization and specification of the lateral floor plate in zebrafish, 117-129, Copyright (2007) with permission from Elsevier. Full text @ Dev. Biol.