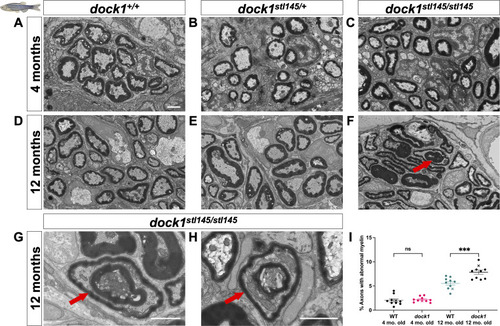
Age-dependent myelin maintenance defects are present in dock1 MUTs. (A–C) TEM of cross-sections of ZMBs from 4-mo-old WT dock1+/+, HET dock1stl145/+, and homozygous dock1stl145/stl145 MUT zebrafish. (D–F) TEM micrographs of ZMBs from 12-mo-old WT dock1+/+, HET dock1stl145/+, and homozygous dock1stl145/stl145 MUT zebrafish, with homozygous MUTs exhibiting myelin outfoldings (red arrow). (G and H) Higher-magnification TEM micrographs of ZMBs from 12-mo-old homozygous dock1stl145/stl145 MUTs showing abnormally myelinated axons (red arrows), features rarely seen in WT dock1+/+ or HET dock1stl145/+ animals. (I) Quantification of the percent of axons with abnormal myelin profiles, observed by TEM, in WT dock1+/+ versus homozygous dock1stl145/stl145 MUTs at 4 and 12 mo old, n = 10 (WT dock1+/+ 4 mo old), 10 (dock1stl145/stl145 MUT 4 mo old), 10 (WT dock1+/+ 12 mo old), and 10 (dock1stl145/stl145 MUT 12 mo old). Here, and in all figures, the X symbol in the graph denotes a data point corresponding to the representative image shown. (A–H) Scale bar = 1 µm. (I) Two-way ANOVA with Tukey’s multiple comparisons test. ***P < 0.001; ns, not significant.
|
