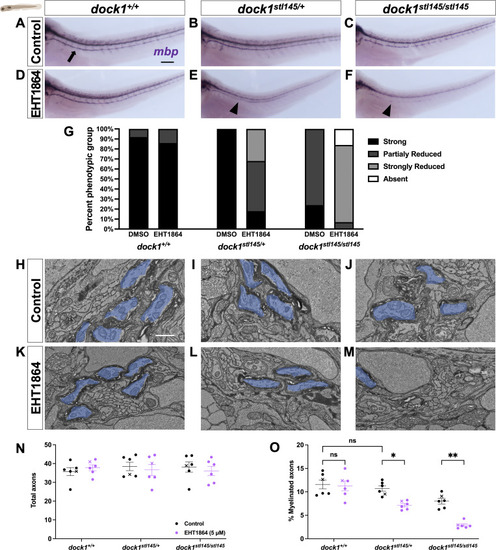
dock1 MUT zebrafish are sensitized to Rac1 inhibition. (A–F) Lateral views of larvae showing mbp expression by WISH in DMSO control-treated and EHT1864-treated WT dock1+/+, HET dock1stl145/+, and homozygous dock1stl145/stl145 MUT zebrafish. (A) The arrow points to strong mbp expression in the PLLn. (E and F) Arrowheads highlight decreased mbp expression in the PLLn. (G) The quantification of WISH was assessed by examining mbp expression along the entire PLLn in 4 dpf DMSO and EHT1864 zebrafish, comparing phenotypic scores and genotypes. (H–M) TEM micrographs of cross-sections of the PLLn, showing myelinated axons pseudocolored in blue, in DMSO control-treated and EHT1864-treated WT dock1+/+, HET dock1stl145/+, and homozygous dock1stl145/stl145 MUT zebrafish. (N and O) Quantifications of the total axons and myelinated axons in the PLLn. n = 6 fish per genotype (DMSO control) and 6 fish per genotype (EHT1864). Here, and in all figures, the X symbol in the graph denotes a data point corresponding to the representative image shown. (A–F) Scale bar = 100 µm. (H–M) Scale bar = 1 µm. (N and O) Two-way ANOVA with Sidak’s multiple comparisons test. **P < 0.01; *P < 0.05; ns, not significant.
|
