|
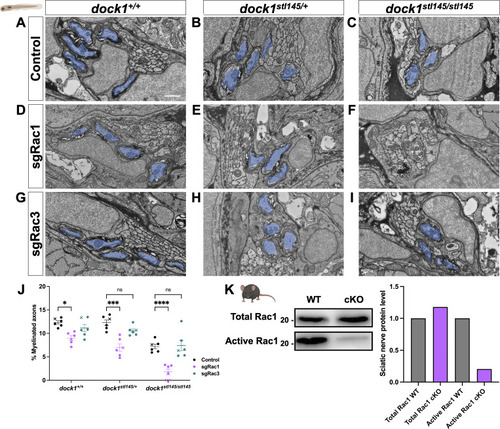
Targeted genetic approaches reveal an interaction between Dock1 and Rac1 in the developing PNS. (A–I) TEM micrographs of cross-sections of the PLLn, showing myelinated axons pseudocolored in blue, in control (Cas9 only), sgRac1+Cas9, and sgRac3+Cas9 in WT dock1+/+, HET dock1stl145/+, and homozygous dock1stl145/stl145 MUT zebrafish. (J) Quantification of myelinated axons in the PLLn. n = 6 fish per genotype and experimental condition. (K) Western blot showing sciatic nerve active and total Rac1 protein levels from control and Dock1 cKO animals, along with quantification of protein levels. Representative blot consisting of 12 nerves from 6 animals per genotype. Here, and in all figures, the X symbol in the graph denotes a data point corresponding to the representative image shown. (A–I) Scale bar = 100 µm. (J) Two-way ANOVA with Sidak’s multiple comparisons test. ***P < 0.001; *P < 0.05; ****P < 0.0001; ns, not significant. Source data are available for this figure: SourceData F7.
|