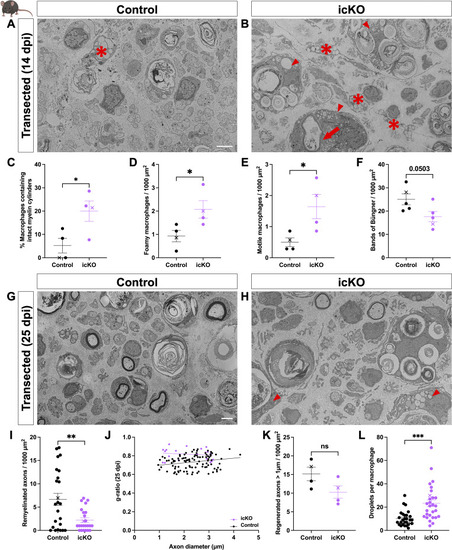
Remyelination is delayed following sciatic nerve transection in Dock1 icKO mice. (A and B) TEM micrographs of sciatic nerves from control-injected (control) and tamoxifen-injected PlpCre+;Dock1fl/fl mice (icKO) 14 days after transection. Quantification reveals that icKO mice show (C) higher numbers of macrophages containing intact myelin cylinders (red arrow), (D) foamy macrophages (red arrowheads), and (E) motile macrophages (asterisks). (F) There was a trend in the icKO animals toward having fewer Bands of Büngner compared with WT; however, this was not statistically significant. (G and H) TEM micrographs of sciatic nerves from control-injected and tamoxifen-injected PlpCre+;Dock1fl/fl mice 25 days after transection. (I) Quantification of the number of remyelinated axons per 1,000 µm2, (J) g-ratio as it relates to axon caliber between control and icKO mice, (K) the number of regenerated axons >1 µm per 1,000 µm2, and (L) the number of droplets per macrophage (red arrowheads). n = 4 mice, 4 images per nerve (control); 4 mice, 4 images per nerve (icKO). Here, and in all figures, the X symbol in the graph denotes a data point corresponding to the representative image shown. (A, B, G, and H) Scale bar = 2 µm. (C–F, I, K, and L) Unpaired t test with Welch’s correction. ***P < 0.001; **P < 0.01; *P < 0.05; ns, not significant.
|
