
Fig. 4
- ID
- ZDB-FIG-240731-74
- Publication
- Lee et al., 2024 - Mycb and Mych stimulate Müller glial cell reprogramming and proliferation in the uninjured and injured zebrafish retina
- Other Figures
- All Figure Page
- Back to All Figure Page
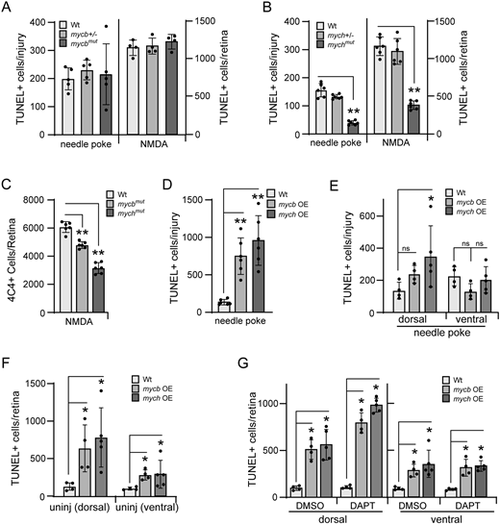
Regulation of neuronal apoptosis by Mycb and Mych in injured and uninjured retinas. (A,B) Bar graphs showing the number of TUNEL+ cells in needle poke and NMDA-treated retinas of Wt (A,B), mycbmut (A) and mychmut (B) fish at 1 dpi. (C) Bar graph showing the number of 4C4-positive cells in Wt, mycbmut and mychmut fish at 2 dpi. (D) Bar graph showing the number of TUNEL+ cells in needle poke-injured fish retina overexpressing Mycb or Mych at 1 dpi. (E,F) Bar graphs showing the number of TUNEL+ cells in dorsal and ventral regions of injured (E) or uninjured (F) retinas with Mycb or Mych OE. (G) Bar graph showing the number of TUNEL+ cells in dorsal and ventral regions of uninjured retinas treated with DAPT and Mycb or Mych OE for 1 day. The number of biological replicates (n) is indicated by the dots in each graph. Error bars are s.d. *P<0.05, **P<0.01. The number of biological replicates is indicated by the dots in each graph. OE, overexpression. |