
Fig. 1
- ID
- ZDB-FIG-240731-71
- Publication
- Lee et al., 2024 - Mycb and Mych stimulate Müller glial cell reprogramming and proliferation in the uninjured and injured zebrafish retina
- Other Figures
- All Figure Page
- Back to All Figure Page
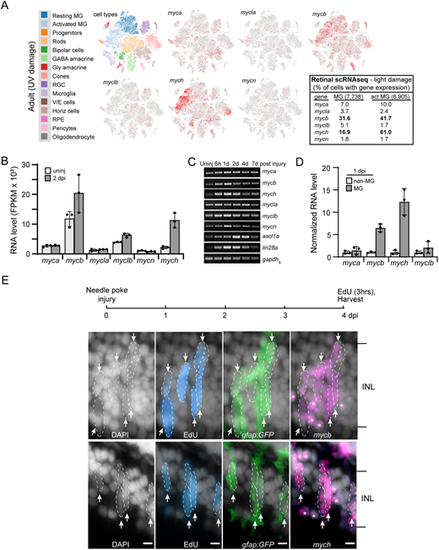
Myc family gene expression in uninjured and injured zebrafish retina. (A) Retinal scRNAseq UMAP plots showing Myc family gene expression in uninjured and injured retina (data taken from Hoang et al., 2020). Red dots indicate the Myc gene-expressing cells in the uninjured and injured retina. By comparing resting MG with activated MG one can discern the changes in gene expression as MG respond to retinal injury [the percentage of total and activated (act) MG with detectable expression of each Myc family member is shown in the table shown on the right]. (B) MG RNAseq quantification of normalized gene reads for Myc family members. (C) PCR and agarose gel analysis of temporal changes in Myc family gene expression following retinal injury. (D) RNA levels of select Myc family genes in FACS-separated GFP+ MG and GFP− non-MG cells isolated from gfap:GFP fish retinas. (E) Top is experimental timeline. gfap:GFP fish received a needle poke injury and then an intravitreal injection of EdU 3 h before being euthanized at 4 dpi. Retinal sections were stained with DAPI to identify nuclei (gray/white), click-iT chemistry was used to identify EdU+ cells (blue), immunofluorescence was used with anti-GFP antibody to identify MG (green), and fluorescence-based mycb and mych in situ hybridization assays were used to identify mycb- and mych-expressing cells (magenta). Arrows and dashed lines outline clusters of mycb+ or mych+ MG and MG-derived progenitors that are EdU+ and GFP+. White asterisks indicate mycb and mych expression in neurons (gfap:GFP− cells). The number of biological replicates (n) is indicated by the dots in each graph. act MG, activated Muller glia; d, day; dpi, days post injury; FPKM, fragments per kilobase of transcript per million mapped reads; INL, inner nuclear layer; MG, Müller glia; V/E cells, vascular endothelial cells. Arrows point to EdU+;GFP+;mycb+ MG and EdU+;GFP+;mych+ MG. Scale bars: 20 μm. |