
- Title
-
Mycb and Mych stimulate Müller glial cell reprogramming and proliferation in the uninjured and injured zebrafish retina
- Authors
- Lee, M.S., Jui, J., Sahu, A., Goldman, D.
- Source
- Full text @ Development
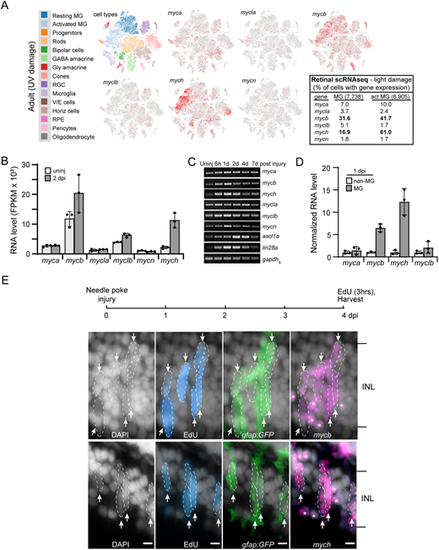
Myc family gene expression in uninjured and injured zebrafish retina. (A) Retinal scRNAseq UMAP plots showing Myc family gene expression in uninjured and injured retina (data taken from Hoang et al., 2020). Red dots indicate the Myc gene-expressing cells in the uninjured and injured retina. By comparing resting MG with activated MG one can discern the changes in gene expression as MG respond to retinal injury [the percentage of total and activated (act) MG with detectable expression of each Myc family member is shown in the table shown on the right]. (B) MG RNAseq quantification of normalized gene reads for Myc family members. (C) PCR and agarose gel analysis of temporal changes in Myc family gene expression following retinal injury. (D) RNA levels of select Myc family genes in FACS-separated GFP+ MG and GFP− non-MG cells isolated from gfap:GFP fish retinas. (E) Top is experimental timeline. gfap:GFP fish received a needle poke injury and then an intravitreal injection of EdU 3 h before being euthanized at 4 dpi. Retinal sections were stained with DAPI to identify nuclei (gray/white), click-iT chemistry was used to identify EdU+ cells (blue), immunofluorescence was used with anti-GFP antibody to identify MG (green), and fluorescence-based mycb and mych in situ hybridization assays were used to identify mycb- and mych-expressing cells (magenta). Arrows and dashed lines outline clusters of mycb+ or mych+ MG and MG-derived progenitors that are EdU+ and GFP+. White asterisks indicate mycb and mych expression in neurons (gfap:GFP− cells). The number of biological replicates (n) is indicated by the dots in each graph. act MG, activated Muller glia; d, day; dpi, days post injury; FPKM, fragments per kilobase of transcript per million mapped reads; INL, inner nuclear layer; MG, Müller glia; V/E cells, vascular endothelial cells. Arrows point to EdU+;GFP+;mycb+ MG and EdU+;GFP+;mych+ MG. Scale bars: 20 μm. |
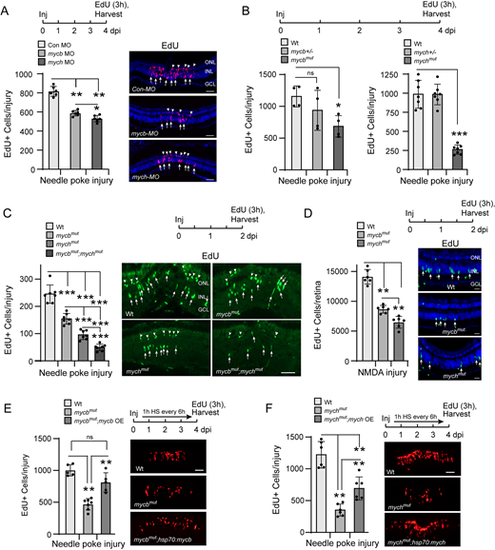
Mycb and Mych regulate MG proliferation in the injured retina. (A) Experimental timeline is shown at the top. Bar graph (left) and representative images (right) show the consequence of Mycb and Mych knockdown with antisense morpholino-modified oligonucleotide (MO) on MG proliferation (EdU+ cells, magenta, arrows) and rod progenitor proliferation (arrowheads in ONL) in needle poke-injured retina at 4 dpi. Retinal cells identified with DAPI (blue). (B) Experimental timeline is shown at the top. Bar graphs show the consequence of Mycb and Mych mutation on MG proliferation (EdU+ cells) in needle poke-injured retina at 4 dpi. (C) Experimental timeline is shown above the photomicrographs (right). Arrows point to proliferating MG in the INL and arrowheads point to proliferating rod progenitors in the ONL. Bar graph (left) and representative images (right) show the consequence of individual and combined Mycb and Mych mutation on MG proliferation (EdU+ cells; green) in the needle poke-injured retina at 2 dpi. (D) As in C, but NMDA was used to injure the retina. Retinal cells identified with DAPI (blue). (E,F) Experimental timeline is shown above the photomicrographs [arrow indicates 1 h heat shock (HS) repeated every 6 h]. Bar graph (left) and representative images (right) show that mycb OE rescues MG proliferation (EdU detection, red) in mycbmut;hsp70l:mycb fish (E), and mych OE only partially rescues MG proliferation in mychmut;hsp70l:mych fish (F). The number of biological replicates (n) is indicated by the dots in each graph. Error bars are s.d. *P<0.05, **P<0.01, ***P<0.001. dpi, days post-injury; GCL, ganglion cell layer; HS, heat shock; Inj, injury; INL, inner nuclear layer; ns, not significant; OE, overexpression; ONL, outer nuclear layer. Scale bars: 100 μm (A,C,E,F); 50 μm (D). |
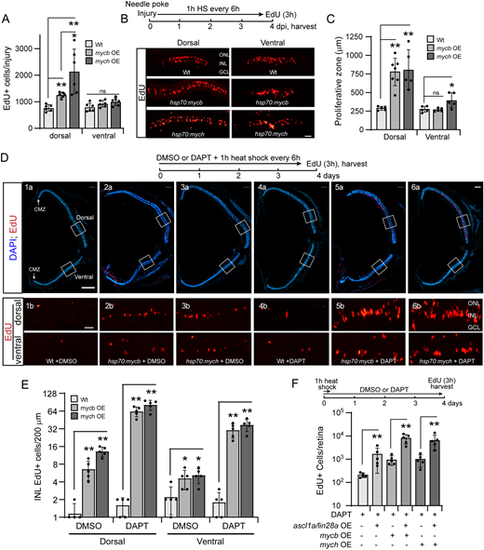
Mycb and Mych OE stimulate MG proliferation in the injured and uninjured retina. (A) Bar graph indicating increased MG proliferation (EdU detection, red) at 4 dpi in dorsal and ventral needle poke injured retina with or without Mycb or Mych OE (1 h heat shock repeated every 6 h). Experimental timeline is shown in B. (B) Top: Experimental timeline. Bottom: Representative images used to quantify EdU+ cells as shown in A. (C) Bar graph showing the width of the zone of proliferating MG in the needle poke-injured retina with Mycb or Mych OE as described in A. (D) Experimental timeline is shown at the top. Panels 1a-6a show whole uninjured retina sections taken near the optic nerve head. DAPI-stained nuclei are blue and EdU+ cells are red. Wt and transgenic fish ±DAPT were treated with 1 h heat shock every 6 h, and 3 h before being euthanized fish received an IP injection of EdU. White squares are examples of the dorsal and ventral retinal regions magnified in panels 1b-6b and used for the quantification shown in E. (E) Bar graph showing quantification of EdU+ cells in uninjured retinas treated as in D. (F) Bar graph showing the effects Mycb and Mych OE (1 h heat shock every 6 h) have on MG proliferation (EdU+ cells) in DAPT-treated uninjured retinas with and without Ascl1a/Lin28a OE (1 h heat shock every 6 h). Fish received an IP injection of EdU 3 h before sacrifice on day 4. The number of biological replicates is indicated by the dots in each graph. Error bars are s.d. *P<0.05, **P<0.01. The number of biological replicates (n) is indicated by the dots in each graph. dpi, days post-injury; GCL, ganglion cell layer; HS, heat shock; INL, inner nuclear layer; IP, intraperitoneal; ns, not significant; OE, overexpression; ONL, outer nuclear layer. Scale bars: 50 μm (B); 100 μm (D). |
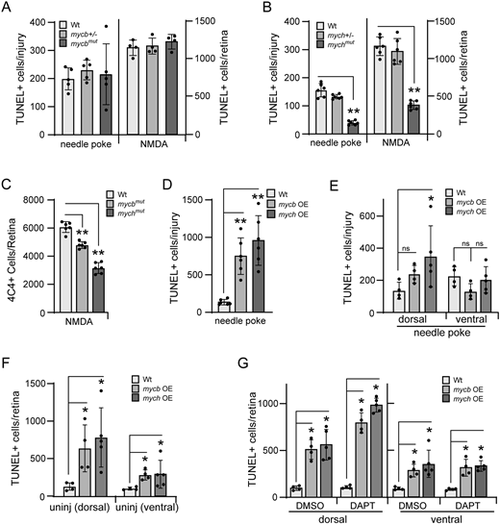
Regulation of neuronal apoptosis by Mycb and Mych in injured and uninjured retinas. (A,B) Bar graphs showing the number of TUNEL+ cells in needle poke and NMDA-treated retinas of Wt (A,B), mycbmut (A) and mychmut (B) fish at 1 dpi. (C) Bar graph showing the number of 4C4-positive cells in Wt, mycbmut and mychmut fish at 2 dpi. (D) Bar graph showing the number of TUNEL+ cells in needle poke-injured fish retina overexpressing Mycb or Mych at 1 dpi. (E,F) Bar graphs showing the number of TUNEL+ cells in dorsal and ventral regions of injured (E) or uninjured (F) retinas with Mycb or Mych OE. (G) Bar graph showing the number of TUNEL+ cells in dorsal and ventral regions of uninjured retinas treated with DAPT and Mycb or Mych OE for 1 day. The number of biological replicates (n) is indicated by the dots in each graph. Error bars are s.d. *P<0.05, **P<0.01. The number of biological replicates is indicated by the dots in each graph. OE, overexpression. |
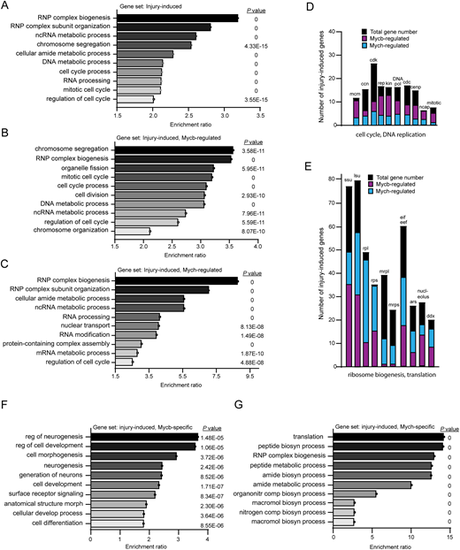
Cellular process enrichment analysis reveals that Mycb and Mych regulate biological processes associated with ribosome biogenesis, protein synthesis, chromosome segregation, and cell cycle. (A-C,F,G) Top 10 enriched biological processes for injury-induced genes in Wt fish (A), Mycb-dependent injury-induced genes (B), Mych-dependent injury-induced genes (C), Mycb-, but not Mych-dependent injury-induced genes (F), and Mych-, but not Mycb-dependent injury-induced genes (G). (D,E) Examples of gene families that are induced in reprogrammed MG and the number of family members that are regulated by Mycb and/or Mych. ars, aminoacyl tRNA synthetases; ccn, cyclin; cdc, cell division cycle; cdk, cyclin-dependent kinase; cenp, centromere protein; ddx, deadbox genes; DNA pol, DNA polymerase; eif eef, eukaryotic translation initiation factors and eukaryotic translation elongation factors; kin, kinetochore; lsu, large ribosomal subunit biogenesis; mcm, minichromosome maintenance; mrpl, mitochondrial ribosomal protein large; mrps, mitochondrial ribosomal protein small; ncap, non-SMC condensing; rep, DNA replication; rpl, ribosomal protein large; rps, ribosomal protein small; ssu, small ribosome subunit biogenesis. |
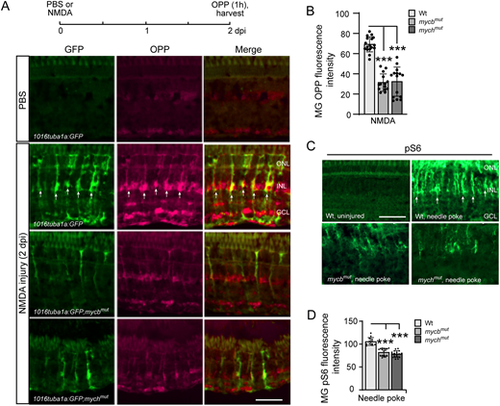
Injury-induced protein synthesis in reprogrammed MG is regulated by Mycb and Mych. (A) Experimental timeline is shown at the top. Representative images showing OPP-based protein synthesis detection in 1016 tuba1a:GFP, 1016 tuba1a:GFP;mycbmut and 1016 tuba1a:GFP;mychmut fish retinas at 2 days post-intravitreal injection of PBS or NMDA. Arrows point to GFP+/OPP+ co-stained cells, which are predominantly detected in 1016 tuba1a:GFP fish. (B) Quantification of data presented in A and additional experiments. (C) pS6 immunofluorescence on uninjured and injured (2 dpi) retinas from Wt, mycbmut and mychmut fish. Arrows point to representative pS6+ cells, which are predominantly detected in the injured fish retina. (D) Quantification of pS6 immunofluorescence in Wt, mycbmut and mychmut fish. The number of biological replicates (n) is indicated by the dots in each graph. ***P<0.001. dpi, days post injury; GCL, ganglion cell layer; INL, inner nuclear layer; ONL, outer nuclear layer; OPP, O-propargyl-puromycin. Scale bars: 100 μm. |