FIGURE

Figure 2

ID
ZDB-FIG-221226-99
Publication
Nascimento et al., 2022 - New Insights into the Identity of the DFNA58 Gene
Other Figures
All Figure Page
Back to All Figure Page
Figure 2

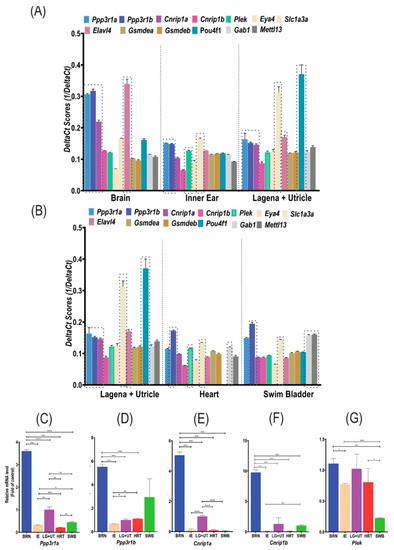
RT-qPCR and transcriptome data analysis of the DFNA58 genes and the reference/control genes. (A,B) Comparison of the level of expression of each gene in each tissue using 1/deltaCt values (RT-qPCR). (CG) Relative quantification (delta-delta Ct of Pfafll [45]) regarding each DFNA58 gene (other genes in the Supplementary Figure S1) in different tissues of the adult zebrafish (lagena + utricle as the reference sample, the other tissues being fold of its expression). In (HL), results of the reanalysis of data from transcriptomes, comparing the expression levels of genes from the DFNA58 locus and the reference genes regarding the zebrafish inner ear hair cells (HC) and their nonsensory surrounding cells (nsSC) in (H) and regarding the DFNA58 genes in the microglia [35], liver [34], and inner ear cells [25], as made available for public access by authors for reanalysis as part of open science. LG + UT: lagena + utricle; BRN: brain; HRT: heart; SWB: swim bladder; IE: inner ear. *,**,***,**** mean increasing levels of significance.

Expression Data
Genes:
Fish:
Anatomical Terms:
Stage: Adult

Expression Detail
Antibody Labeling
Phenotype Data

Phenotype Detail
Acknowledgments
This image is the copyrighted work of the attributed author or publisher, and ZFIN has permission only to display this image to its users. Additional permissions should be obtained from the applicable author or publisher of the image. Full text @ Genes (Basel)