
- Title
-
New Insights into the Identity of the DFNA58 Gene
- Authors
- Nascimento, L.R.D., Vieira-Silva, G.A., Kitajima, J.P.F.W., Batissoco, A.C., Lezirovitz, K.
- Source
- Full text @ Genes (Basel)
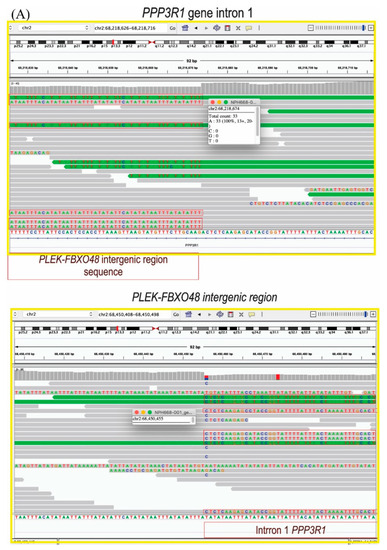
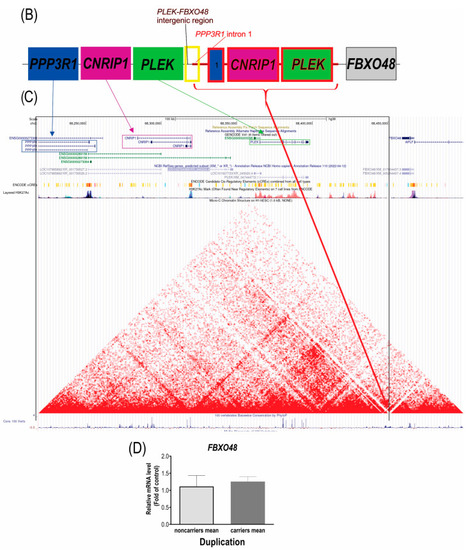
(A) Image of the WGS reads that showed the breakpoints 1 and 2 of the duplication and, contrary to the previous hypothesis, formulated based on the fusion transcripts, the duplication is in tandem, inserted in the breakpoint 2, in a repetitive region of (TA)n. (B) Scheme of the duplication (in red) showing its insertion site between the PLEK and FBXO48 genes. (C) Analysis of insertion site and topological features. The black frame indicates the duplicated segment, the red arrow indicates the duplication insertion location on the border between the two domains; therefore, it does not interrupt either domain. (D) Gene expression analysis by RT-qPCR in the blood of the DFNA58 family members, comparing the means of normal-hearing noncarriers and hearing-impaired duplication carriers. |
(A) Image of the WGS reads that showed the breakpoints 1 and 2 of the duplication and, contrary to the previous hypothesis, formulated based on the fusion transcripts, the duplication is in tandem, inserted in the breakpoint 2, in a repetitive region of (TA)n. (B) Scheme of the duplication (in red) showing its insertion site between the PLEK and FBXO48 genes. (C) Analysis of insertion site and topological features. The black frame indicates the duplicated segment, the red arrow indicates the duplication insertion location on the border between the two domains; therefore, it does not interrupt either domain. (D) Gene expression analysis by RT-qPCR in the blood of the DFNA58 family members, comparing the means of normal-hearing noncarriers and hearing-impaired duplication carriers. |

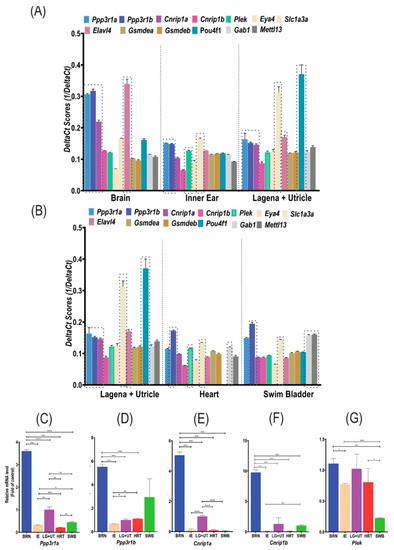
RT-qPCR and transcriptome data analysis of the DFNA58 genes and the reference/control genes. ( |
RT-qPCR and transcriptome data analysis of the DFNA58 genes and the reference/control genes. ( |
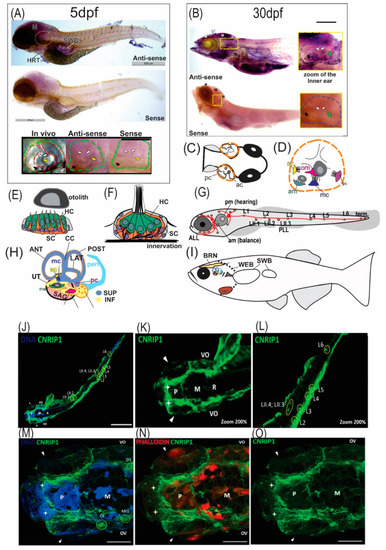
Expression and localization analysis of EXPRESSION / LABELING:
|
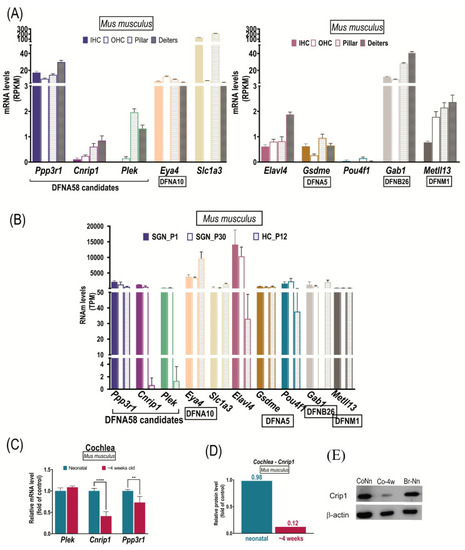
Reanalysis of transcriptome data from different studies. ( |