
FIGURE
Fig. 2
- ID
- ZDB-FIG-220829-191
- Publication
- Stagaman et al., 2022 - Experimental methods modestly impact interpretation of the effect of environmental exposures on the larval zebrafish gut microbiome
- Other Figures
- All Figure Page
- Back to All Figure Page
Fig. 2
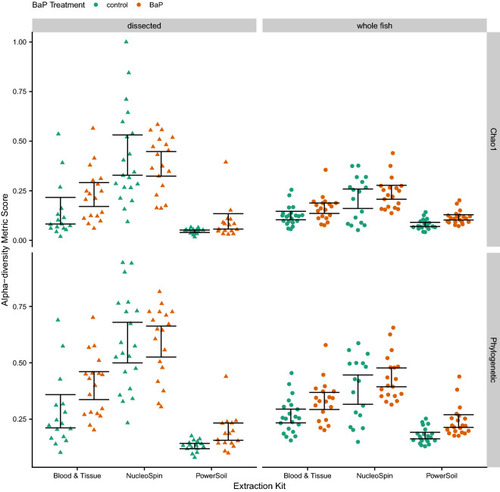
Swarm plots of Chao1 and Phylogenetic alpha-diversity metrics by dissection method and DNA extraction kit. The color of the point indicates BaP treatment (unexposed control vs. exposed). The black error bars indicate bootstrapped 95% C.I.s of the means. |
Expression Data
Expression Detail
Antibody Labeling
Phenotype Data
Phenotype Detail
Acknowledgments
This image is the copyrighted work of the attributed author or publisher, and
ZFIN has permission only to display this image to its users.
Additional permissions should be obtained from the applicable author or publisher of the image.
Full text @ Sci. Rep.