
FIGURE
Fig. 4
- ID
- ZDB-FIG-220829-193
- Publication
- Stagaman et al., 2022 - Experimental methods modestly impact interpretation of the effect of environmental exposures on the larval zebrafish gut microbiome
- Other Figures
- All Figure Page
- Back to All Figure Page
Fig. 4
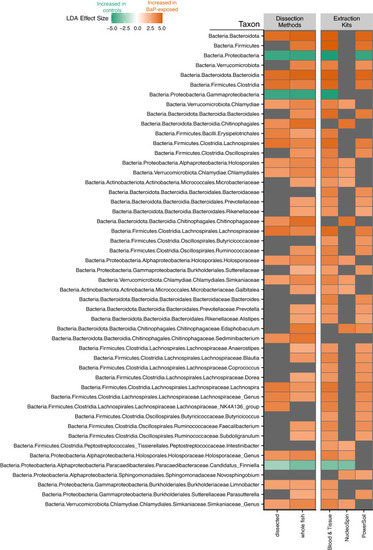
Heatmap of statistically significant effect sizes estimated by LEfSe. This plot only shows phylotypes that were consistently identified as indicators across at least two data sets. The color of the square indicates the effect size with green meaning a phylotype is indicative of the control (no BaP exposure) while orange means a phylotype is indicative of BaP exposure. Gray squares indicate the taxon is not an indicator for either the control or treatment for that data set. |
Expression Data
Expression Detail
Antibody Labeling
Phenotype Data
Phenotype Detail
Acknowledgments
This image is the copyrighted work of the attributed author or publisher, and
ZFIN has permission only to display this image to its users.
Additional permissions should be obtained from the applicable author or publisher of the image.
Full text @ Sci. Rep.