
FIGURE
Fig. 6
- ID
- ZDB-FIG-220829-195
- Publication
- Stagaman et al., 2022 - Experimental methods modestly impact interpretation of the effect of environmental exposures on the larval zebrafish gut microbiome
- Other Figures
- All Figure Page
- Back to All Figure Page
Fig. 6
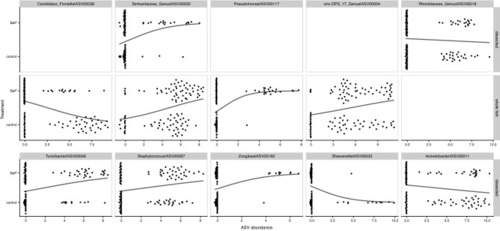
Swarm plots of logistic regressions predicting BaP exposure from individual ASV abundances (centered log-ratio transformed) using data subsets partitioned by dissection method. The top 10 taxa, ordered by importance according to the preceding random forest analysis are presented in this figure. Points indicate an ASV’s abundance per each dissection method. Black lines indicate the predicted relationship taken directly from the logistic regression models. |
Expression Data
Expression Detail
Antibody Labeling
Phenotype Data
Phenotype Detail
Acknowledgments
This image is the copyrighted work of the attributed author or publisher, and
ZFIN has permission only to display this image to its users.
Additional permissions should be obtained from the applicable author or publisher of the image.
Full text @ Sci. Rep.