
Fig. 3
- ID
- ZDB-FIG-220829-192
- Publication
- Stagaman et al., 2022 - Experimental methods modestly impact interpretation of the effect of environmental exposures on the larval zebrafish gut microbiome
- Other Figures
- All Figure Page
- Back to All Figure Page
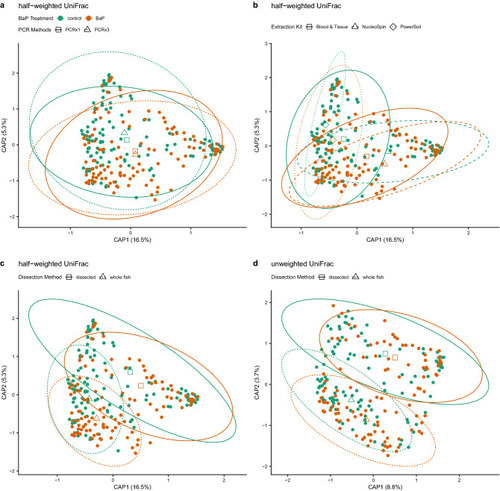
dbRDA ordinations of differences in zebrafish microbiome composition (beta-diversity) highlighting various significant associations between differences in composition and methodology. In all panels, solid points are colored by BaP treatment, open shapes (triangles, diamonds, squares) indicate centroids of each BaP treatment by processing method interaction, and ellipses demarcate 95% C.I.s for these centroids. Panels a-c depict identical half-weighted UniFrac ordinations with different statistical associations highlighted. (a) BaP exposure and PCR replication (1x vs. 3x); open squares and solid lines indicate centroids and their 95% C.I.s for single PCR samples, open triangles and dashed lines indicate centroids and their 95% C.I.s for triplicate PCR samples. (b) BaP exposure and DNA extraction kit; open squares and solid lines indicate centroids and their 95% C.I.s for Blood & Tissue-extracted samples, open triangles and dashed lines indicate centroids and their 95% C.I.s for NucleoSpin-extracted samples, and open diamonds and dotted lines indicate centroids and their 95% C.I.s for PowerSoil-extracted samples. (c) BaP exposure and dissection method; open squares and solid lines indicate centroids and their 95% C.I.s for dissected intestine samples, open triangles and dashed lines indicate centroids and their 95% C.I.s for whole fish samples. Panel (d) depicts an unweighted UniFrac ordination with the statistical interaction between BaP and dissection method highlighted with the same information overlaid as in panel (c). |