
- Title
-
Experimental methods modestly impact interpretation of the effect of environmental exposures on the larval zebrafish gut microbiome
- Authors
- Stagaman, K., Kasschau, K.D., Tanguay, R.L., Sharpton, T.J.
- Source
- Full text @ Sci. Rep.
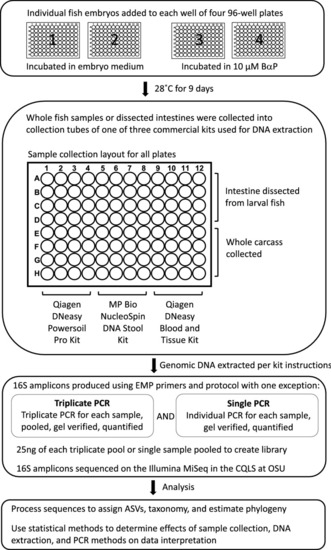
Experimental design. Overview of the methods analyzed for impact on interpretation of experimental results. First panel, 384 zebrafish larvae were distributed across the wells of four 96-well round-bottom plates. For two of these plates, the larvae were left untreated, while the larvae of the other two plates were exposed to 10 µM benzo-[a]-pyrene by way of their growth media. The zebrafish were raised in their wells on these plates until 9 days post fertilization. Second panel, for each of the four plates we conducted a fully factorial splitting of the samples by dissection method and DNA extraction kit. Half of the samples on each plate had their intestines dissected and placed in the collection tube, while for the other half, we placed the whole carcasses in their collection tubes. Then, in a manner orthogonal to dissection method, a third of each set of samples underwent DNA extraction using one of the three extraction kits. Third panel, we prepared 16S rDNA sequencing libraries using either single or triplicate PCR. Every sample was subject to both of these treatments. These libraries were then submitted for sequencing. Bottom panel, upon receiving the 16S sequences, we processed the data for quality and conducted the analyses described herein. |
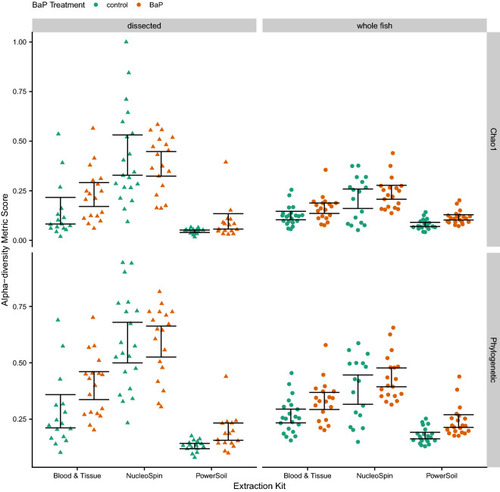
Swarm plots of Chao1 and Phylogenetic alpha-diversity metrics by dissection method and DNA extraction kit. The color of the point indicates BaP treatment (unexposed control vs. exposed). The black error bars indicate bootstrapped 95% C.I.s of the means. |
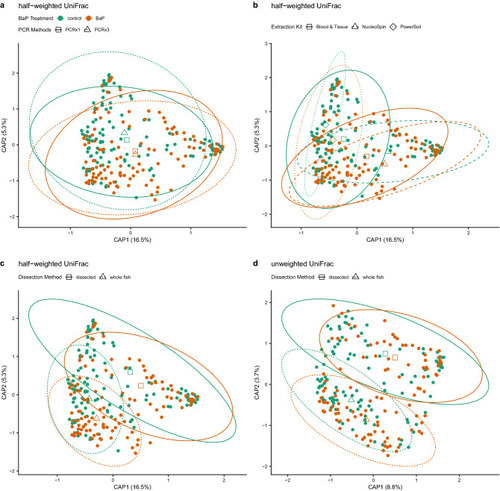
dbRDA ordinations of differences in zebrafish microbiome composition (beta-diversity) highlighting various significant associations between differences in composition and methodology. In all panels, solid points are colored by BaP treatment, open shapes (triangles, diamonds, squares) indicate centroids of each BaP treatment by processing method interaction, and ellipses demarcate 95% C.I.s for these centroids. Panels a-c depict identical half-weighted UniFrac ordinations with different statistical associations highlighted. (a) BaP exposure and PCR replication (1x vs. 3x); open squares and solid lines indicate centroids and their 95% C.I.s for single PCR samples, open triangles and dashed lines indicate centroids and their 95% C.I.s for triplicate PCR samples. (b) BaP exposure and DNA extraction kit; open squares and solid lines indicate centroids and their 95% C.I.s for Blood & Tissue-extracted samples, open triangles and dashed lines indicate centroids and their 95% C.I.s for NucleoSpin-extracted samples, and open diamonds and dotted lines indicate centroids and their 95% C.I.s for PowerSoil-extracted samples. (c) BaP exposure and dissection method; open squares and solid lines indicate centroids and their 95% C.I.s for dissected intestine samples, open triangles and dashed lines indicate centroids and their 95% C.I.s for whole fish samples. Panel (d) depicts an unweighted UniFrac ordination with the statistical interaction between BaP and dissection method highlighted with the same information overlaid as in panel (c). |
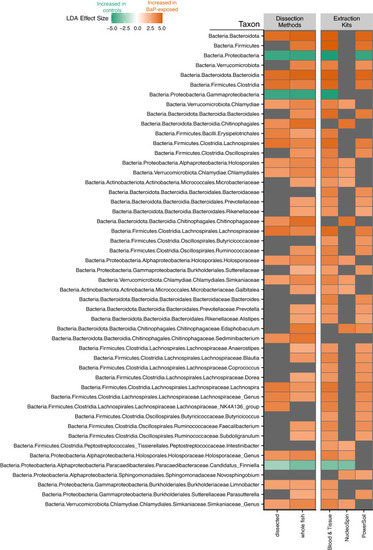
Heatmap of statistically significant effect sizes estimated by LEfSe. This plot only shows phylotypes that were consistently identified as indicators across at least two data sets. The color of the square indicates the effect size with green meaning a phylotype is indicative of the control (no BaP exposure) while orange means a phylotype is indicative of BaP exposure. Gray squares indicate the taxon is not an indicator for either the control or treatment for that data set. |
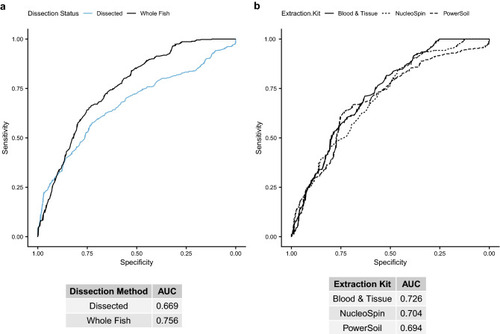
Receiver operating characteristic (ROC) curve plots for random forest models predicting BaP exposure from various data subsets, indicated by line color or line type, of centered log-ratio transformed ASV counts. Tables under each panel indicate the area under the ROC curve (AUC) for each model. A higher AUC indicates a better model, with an AUC of 0.5 indicating a 50% chance (essentially a random guess) of the model correctly predicting BaP exposure from taxon abundances. (a) ROC curves for dissected intestine samples (blue line) versus whole fish samples (black line), with the areas under the curve (AUCs) listed in the table below. (b) Similar data as in panel a, but for subsets by DNA extraction kit: solid line = Blood & Tissue, short dashed line = NucleoSpin, long dashed line = PowerSoil. |
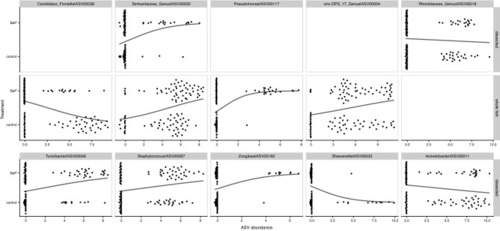
Swarm plots of logistic regressions predicting BaP exposure from individual ASV abundances (centered log-ratio transformed) using data subsets partitioned by dissection method. The top 10 taxa, ordered by importance according to the preceding random forest analysis are presented in this figure. Points indicate an ASV’s abundance per each dissection method. Black lines indicate the predicted relationship taken directly from the logistic regression models. |
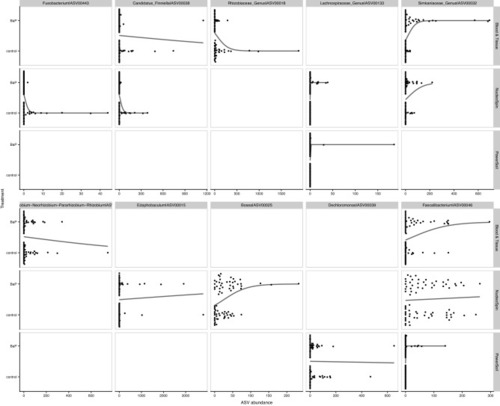
Swarm plots of logistic regressions predicting BaP exposure from individual ASV abundance (centered log-ratio transformed) using data subsets partitioned by dissection method. The top 10 taxa, ordered by importance from the preceding random forest analysis are presented in this figure. Points indicate an ASV’s abundance per each dissection method. Black lines indicate the predicted relationship taken directly from the logistic regression models. |