
Image
|
Figure Caption
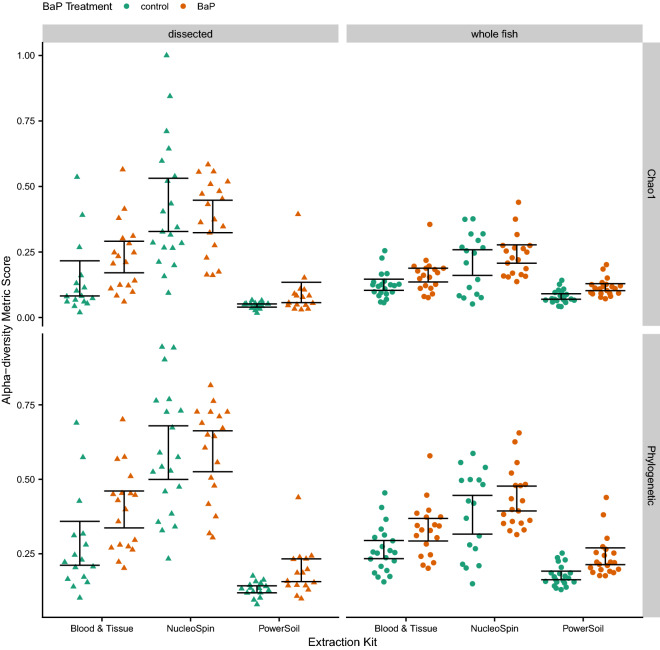
Fig. 2
Swarm plots of Chao1 and Phylogenetic alpha-diversity metrics by dissection method and DNA extraction kit. The color of the point indicates BaP treatment (unexposed control vs. exposed). The black error bars indicate bootstrapped 95% C.I.s of the means.
Acknowledgments
This image is the copyrighted work of the attributed author or publisher, and
ZFIN has permission only to display this image to its users.
Additional permissions should be obtained from the applicable author or publisher of the image.
Full text @ Sci. Rep.