
Fig. 5
- ID
- ZDB-FIG-220829-194
- Publication
- Stagaman et al., 2022 - Experimental methods modestly impact interpretation of the effect of environmental exposures on the larval zebrafish gut microbiome
- Other Figures
- All Figure Page
- Back to All Figure Page
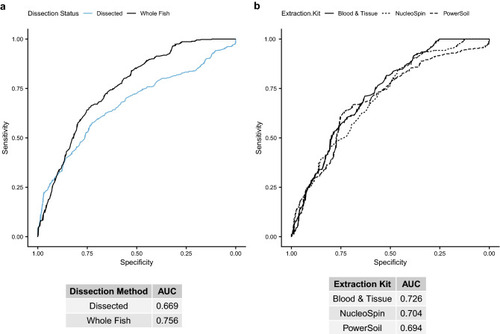
Receiver operating characteristic (ROC) curve plots for random forest models predicting BaP exposure from various data subsets, indicated by line color or line type, of centered log-ratio transformed ASV counts. Tables under each panel indicate the area under the ROC curve (AUC) for each model. A higher AUC indicates a better model, with an AUC of 0.5 indicating a 50% chance (essentially a random guess) of the model correctly predicting BaP exposure from taxon abundances. (a) ROC curves for dissected intestine samples (blue line) versus whole fish samples (black line), with the areas under the curve (AUCs) listed in the table below. (b) Similar data as in panel a, but for subsets by DNA extraction kit: solid line = Blood & Tissue, short dashed line = NucleoSpin, long dashed line = PowerSoil. |