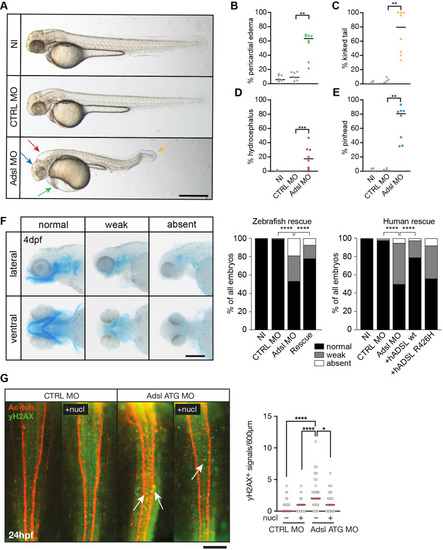
(A) Live images of 48 hr post fertilization (hpf) zebrafish embryos showing pericardial edema (green arrow), kinked tail (yellow arrow), hydrocephalus (red arrow), and pinhead (blue arrow). NI (uninjected controls), CTRL MO (embryos injected with a standard control MO), Adsl ATG MO (injected with a translation blocking MO against Adsl). Scale bar = 500 μm. (B–E) Quantification of the percentage of embryos developing the indicated phenotypes. For (B–E), each circle indicates one experiment. Data from eight experiments with 311 embryos (NI), 275 (CTRL MO), and 227 (Adsl ATG MO) is shown. Kruskal–Wallis test with Dunn’s multiple comparison. Dashes show median. **p=0.0042 (pericardial edema), **p=0.0032 (kinked tail), **p=0.0011 (pinhead), ***p=0.0005 (hydrocephalus). (F) Adsl-depleted zebrafish display skull formation defects. Cartilage staining of zebrafish embryos (4 days post fertilization [dpf]) with Alcian Blue. Embryos were classified according to the severity of their phenotype in normal staining, weak staining, or absent cartilage. Lateral and ventral view. Cartilage formation could be rescued by co-injection of capped mRNA encoding zebrafish Adsl. 6–8 experiments with a total of 178 embryos (NI), 133 (CTRL MO), 169 (Adsl ATG MO), and 123 (Rescue). Injection of mRNA encoding human wt ADSL, but not the R426H ADSLD variant, restores cartilage formation in embryos. Four experiments with a total of 116 embryos (NI), 81 (CTRL MO), 80 (Adsl ATG MO), 91 (+ hADSL wt), and 89 (+ hADSL R426H). Two-tailed Fisher’s exact test; ****p<0.0001. Scale bar = 200 μm. (G) Immunofluorescence staining of the neural tube (dorsal view) of control and Adsl-depleted embryos 24 hpf for γH2AX (green) and acetylated-tubulin (Ac-tub: red). Treatment with 60 mM nucleosides was carried out in indicated samples. Experiments with 45 embryos per treatment are shown, dashes indicate median. Data were analyzed by using Kruskal–Wallis test with Dunn’s correction. *p<0.05, ****p<0.0001. Scale bar = 300 μm. Unless indicated, comparisons are not significant.