
Figure 4
- ID
- ZDB-FIG-220227-34
- Publication
- Dutto et al., 2022 - Pathway specific effects of ADSL deficiency on neurodevelopment
- Other Figures
- All Figure Page
- Back to All Figure Page
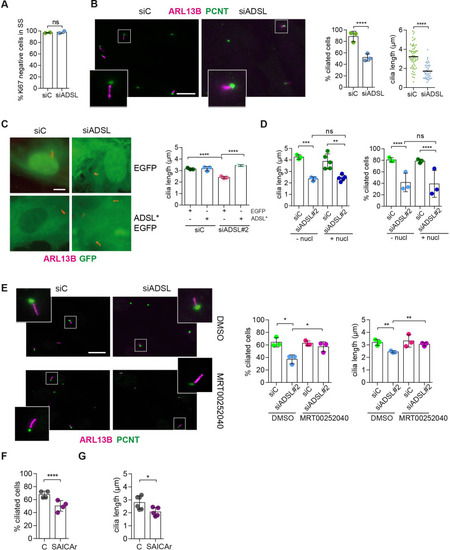
(A) RPE-1 were transfected with control or ADSL smart pool siRNAs. After 96 hr, cells were serum starved for 48 hr to induce ciliogenesis followed by staining against Ki67 and negative cells quantified (n = 2, two-tailed t-test, ns not significant). (B) Ciliated cells silenced as in (A) were stained for ARL13B (magenta) and pericentrin (PCNT) (green). Scale bar = 10 μm. Magenta squares show enlargements of the areas. Graphs show quantification of ciliated cells and cilia length (line indicates median) (n = 3, scored 108 cells for siC, 82 cells for siADSL, ****p<0.0001). (C) RPE1 cells stably expressing EGFP or ADSL*-EGFP were silenced for 96 hr with control or a single ADSL siRNA, serum starved for 48 hr, fixed, and stained for ARL13B (red). Scale bar = 5 μm. Graphs summarize three experiments (one-way ANOVA, ns not significant, ***p<0.001, **p<0.01, *p<0.05). (D) RPE-1 cells silenced with a single ADSL siRNA (siADSL#2) for 96 hr in the absence or presence of 1× nucleosides. Cilia frequency and cilia length were quantified; mean ± SD of n = 3 siC (scored 557 cells) and siADSL (scored 499 cells), n = 5 for siC (588 cells) and siADSL (scored 297 cells) with nucleosides, ns not significant, ***p<0.001. (E) RPE-1 cells were ADSL-depleted, treated or not with MRT00252040 and serum starved, and then immunostained for ARL13B (magenta) and PCNT (green). Cilia frequency and cilia length were quantified (n = 3, scored 261 cells for siC, 166 cells for siADSL, 287 cells for siC + MRT0025204, 170 cells for siADSL + MRT00252040, **p<0.01, ****p<0.0001). Scale bar = 10 μm. (F) Quantification of the cilia frequency in control and SAICAR-treated cells (n = 4, scored 589 cells for control, 456 cells for SAICAR-treated, ****p<0.0001). (G) Cilia length measurement of cells treated as in (F) (n = 5, two-tailed t-test, *p<0.05).
|