
Figure 3
- ID
- ZDB-FIG-220227-32
- Publication
- Dutto et al., 2022 - Pathway specific effects of ADSL deficiency on neurodevelopment
- Other Figures
- All Figure Page
- Back to All Figure Page
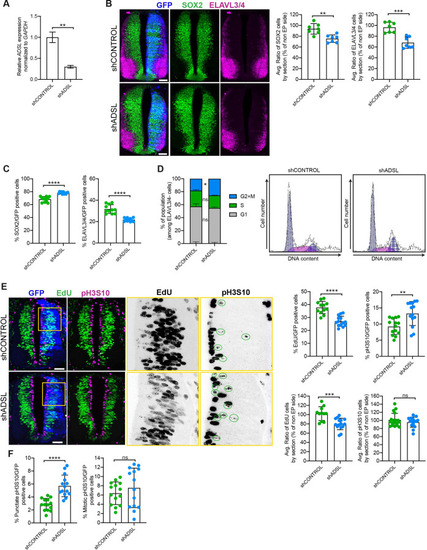
(A) mRNA levels of ADSL and GAPDH were measured by qRT-PCR in chicken embryonic fibroblasts (CEFs) transfected for 24 hr with shCONTROL or shADSL to confirm knockdown efficiency (n = 3, two-tailed t-test, **p<0.01). (B) Transverse sections of HH12 chicken neural tubes 48 hr post electroporation (hpe) with shCONTROL or shADSL plasmids and stained with antibodies against SOX2 (green) and ELAVL3/4 (magenta). Transfection was detected by GFP (blue). Scale bar = 50 μm. Average ratio of neural stem cells (NSCs, SOX2+) 48 hpe with shCONTROL or shADSL obtained by comparing the mean number of SOX2+ cells on the electroporated and non-electroporated side (n = 7 embryos, two-tailed t-test, **p<0.01). Average ratio of cells differentiated into neurons (ELAVL3/4) at 48 hpe with shCONTROL or shADSL obtained by comparing the mean number of ELAVL3/4-positive cells on the electroporated and the non-electroporated side (n = 7 embryos, two-tailed t-test, ***p<0.001). (C) Percentage of electroporated cells identified as NSCs (SOX2) or neurons (ELAVL3/4) 48 hpe with shCONTROL or shADSL (n = 11 embryos, two-tailed t-test, ****p<0.0001). (D) The cell cycle profiles of NSCs (GFP+/ELAVL3/4-) obtained by fluorescence-associated cell sorting (FACS) 48 hpe with shCONTROL or shADSL into HH12 chicken neural tubes. The mean of two independent experiments is shown in the left panel. 6–8 embryos per condition were used for each experiment. Two-tailed t-test was used for statistical analysis of n = 2 independent experiments, ns not significant, *p<0.05. Cell cycle profiles of a representative experiment are shown in the right panels. (E) Transverse sections of HH12 chicken neural tubes 48 hpe with shCONTROL or shADSL plasmids, and stained with EdU (green) and an antibody against pH3S10 (magenta). Transfection was detected by GFP (blue). Scale bar = 50 μm. Areas indicated in yellow are amplified in the right panels showing separated channels in black. Green circles in pH3S10 amplification show punctate pH3S10-positive cells. Percentage of transfected cells identified as EdU-positive 48 hpe with shCONTROL or shADSL (n = 12 embryos [shCONTROL] and 14 embryos [shADSL], two-tailed t-test, ****p<0.0001). Percentage of pH3S10 among the GFP+ cell population 48 hpe with shCONTROL or shADSL (n = 14 embryos, two-tailed t-test, ns not significant, **p<0.01, ****p<0.0001). Average ratio of EdU and pH3S10-positive cells 48 hpe of shCONTROL or shADSL plasmids, obtained by comparing the mean number of EdU cells on the electroporated and the non-electroporated side (EdU: n = 11 embryos [shCONTROL], 15 embryos [shADSL], two-tailed t-test, ***p<0.001; pH3S10: n = 18 embryos [shCONTROL], 15 embryos [shADSL], two-tailed t-test, ns not significant). (F) Percentage of punctate pH3S10 (G2 phase) and mitotic pH3S10 (M phase) among the GFP+ cell population 48 hpe of shCONTROL or shADSL plasmids (n = 14 embryos, two-tailed t-test, ns not significant, ****p<0.0001). Bar graphs show means ± SD.
|