
Figure 2
- ID
- ZDB-FIG-220227-31
- Publication
- Dutto et al., 2022 - Pathway specific effects of ADSL deficiency on neurodevelopment
- Other Figures
- All Figure Page
- Back to All Figure Page
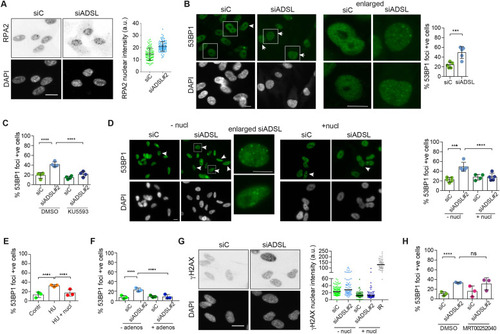
(A) RPE-1 were silenced for 96 hr with a smart pool of ADSL siRNAs, chromatin extracted, and immunostained with an anti-RPA2 antibody. Nuclear intensity of cells was measured- Quantification of one representative experiment of four that showed similar results is shown; SD and average are indicated in black. After normalization to the average of the control (siC), two-tailed t-test was used for statistical analysis of n = 4 independent experiments: *p<0.05 was observed for siADSL to siC. (B) RPE-1 were silenced for 96 hr with a smart pool of ADSL siRNAs, fixed, and immunostained with anti-53BP1 antibody. Scale bar = 10 μm. Quantification of positive cells that have more than five foci per cell (n = 5 scored 1134 cells for siC, 1144 cells for siADSL, ***p<0.001). (C) RPE-1 were silenced with a single control or ADSL siRNA with or without 5 mM ATM inhibitor (KU5593) (n = 4, scored 359 cells for siC, 322 cells for siADSL, 307 cells for siC + KU5593, 279 cells for siADSL + KU5593, ****p<0.0001). (D) Cells were silenced for 96 hr, treated or not with 60 μM (1×) nucleosides, and stained for 53BP1. Scale bar = 10 μm (n = 5, scored 717 cells for siC, 608 cells for siADSL, 576 cells for siC + nucl, 512 cells for siADSL + nucl, ****p<0.0001). (E) RPE-1 cells were treated with 2 mM hydroxyurea (HU) for 6 hr and treated or not with 1× nucleosides and stained for 53BP1. Cells with more than five foci per nucleus were counted as positive. Three independent experiments were performed (n = 3, at least 100 cells per experiment per condition were counted, ****p<0.0001). (F) Cells were silenced for 96 hr, treated or not with 80 μg/ml adenosine, and stained for 53BP1 (n = 3, scored 544 cells for siC, 428 cells for siADSL, 485 cells for siC+ adenosine, 411 cells for siADSL + adenosine, ****p<0.0001). (G) RPE-1 treated as in (A) were fixed and stained for γH2AX (H2AX phosphorylated on Ser-139). Scale bar = 10 μm. 5 Gy X-ray irradiation (IR) was used as positive control. Quantification of one representative experiment of two that showed similar results is shown; median is indicated in black. After normalization to the average of the control (siC), one-tailed t-test was used for statistical analysis of n = 3 independent experiments: *p<0.05 was observed for siADSL (to siC), and for siADSL relative to siADSL + nucl. There is no statistical difference between siC and siC + nucl. (H) RPE-1 were silenced in the presence or absence of 4 μM MRT00252040, fixed and stained for 53BP1 (n = 4, scored 367 cells for siC, 313 cells for siADSL, 294 cells for siC + MRT00252040, 241 cells for siADSL + MRT00252040, ns not significant, ****p<0.0001). All bar graphs show means ± SD with individual values in circles.
|