
Figure 1
- ID
- ZDB-FIG-220227-28
- Publication
- Dutto et al., 2022 - Pathway specific effects of ADSL deficiency on neurodevelopment
- Other Figures
- All Figure Page
- Back to All Figure Page
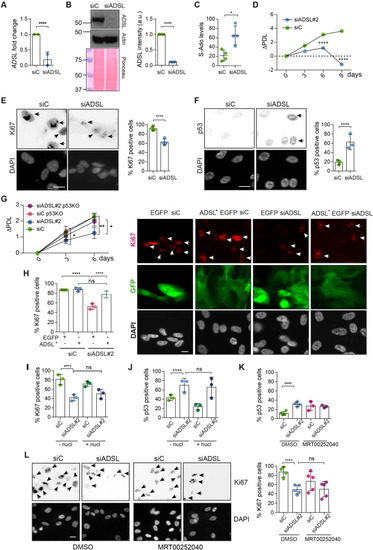
(A) Reduced mRNA levels of ADSL confirmed by qRT-PCR experiments. hTERT-RPE-1 were silenced with smart pool RNAi for 96 hr before harvesting. Two independent experiments in triplicate are shown in the panel (n = 2, two-tailed t-test, ****p<0.0001) (B) Western blot of RPE-1 cell extracts treated as in (A). One experiment is shown as representative of four independent experiments. Actin was used as a loading control. Quantifications of ADSL intensity in four different experiments were performed by ImageJ software and normalized to actin first and then to the relative controls (n = 4, two-tailed t-test, ****p<0.0001). Ponceau is shown as an additional loading and transfer control. (C) S-Ado levels in RPE-1 cells silenced with a single control or ADSL siRNA (n = 4, two-tailed t-test, *p<0.05). (D) Cell proliferation rates of RPE-1 cells quantified every 3 days after treatment with a single control or ADSL siRNA in medium with serum (n = 3, two-tailed t-test ****p<0.0001). ΔPDL represent the difference in population doubling levels quantified through the formula described in Materials and methods. (E) Ki67-positive cells (indicated by arrows) upon 96 hr of silencing with control or ADSL smart pool siRNAs. Scale bar 10 μm (n = 4, scored 767 cells for siC, 694 cells for siADSL conditions, ****p<0.0001). (F) The percentage of p53-positive cells (indicated by arrows) following treatment with control or ADSL smart pool siRNAs was quantified in three independent experiments (n = 3, scored 835 cells for siC and 1126 cells for siADSL, *p<0.05). (G) Cell proliferation rates in RPE-1 wt and p53 knockout KO cells as in (D) were counted for 6 days (n = 3, two-tailed t-test, **p<0.01, *p<0.05). (H) RPE-1 cells stably expressing EGFP or ADSL*-EGFP were transfected with a single control or ADSL siRNAs for 96 hr and immunostained with anti-Ki67 antibody. Scale bar = 20 μm. Quantification of Ki67-positive cells (n = 3, scored 278 cells for EGFP siC, 264 for EGFP siADSL, 266 for ADSL* siC, 232 cells for ADSL* siADSL conditions, ns not significant, ****p<0.0001). (I) Quantification of RPE-1 transfected with a single control or ADSL siRNA for 96 hr in the presence or absence of 60 μM nucleosides. Cells were fixed and immunostained with anti-Ki67 antibody (n = 3, at least 100 cells per conditions were counted in each experiment, ns not significant, ****p<0.0001). (J) Quantification of RPE-1 in the same conditions of (I) and immunostained with anti-p53 antibody (n = 3, at least 100 cells were counted for each condition per experiment, ns not significant, ****p<0.0001). (K) Quantification of p53-positive cells in ADSL-depleted cells in the presence or absence of the phosphoribosylaminoimidazole carboxylase (PAICS) inhibitor MRT00252040 (n = 3, scored 223 cells for siC, 248 cells for siADSL, 336 cells for siC+ MRT00252040, 365 cells for siADSL + MRT00252040, ns not significant, ****p<0.001, *p<0.05). (L) Quantification of Ki67-positive cells in ADSL-depleted cells in the presence or absence of MRT00252040 (n = 5, more than 60 cells were counted in each condition for each experiment, ns not significant, ***p<0.001). Positive cells are indicated with arrows in siADSL panels. All graphs depict means ± SD with individual values shown in circles.
|