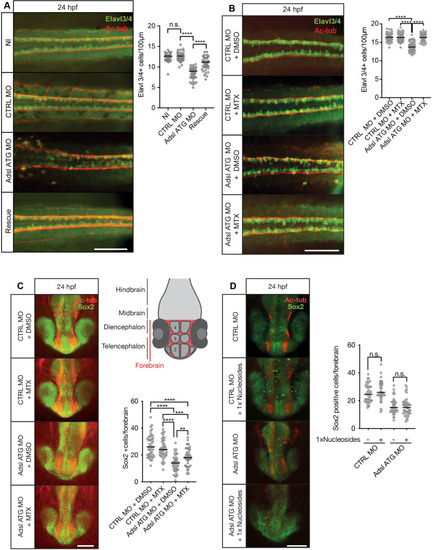
(A) Immunofluorescence whole-mount microscopy of neural tubes of 24 hr post fertilization (hpf) zebrafish embryos (dorsal view) stained for acetylated tubulin (axons, red) and Elavl3/4 (green). Fewer Elavl3/4-positive cells in Adsl-depleted embryos that can be rescued by co-injection with RNA encoding zebrafish Adsl (Rescue). Graph shows Elavl3/4 counts of individual embryos, line indicates median. Three experiments with 45 embryos (NI), 45 (CTRL MO), 45 (Adsl ATG MO), and 45 (Rescue). Kruskal–Wallis test with Dunn’s correction. ns, not significant. p>0.9999, ****p<0.0001. Scale bar = 100 μm. (B) MTX treatment rescues Elavl3/4-positive cell numbers. Staining of the neural tube (dorsal view) of 24 hpf zebrafish embryos for acetylated tubulin (red) and or Elavl3/4 (green). Adsl morphants show fewer Elavl3/4-positive cells, which could be rescued by treatment with 100 µM MTX. Five experiments with 69 (CTRL MO), 75 (CTRL MO + MTX), 63 (Adsl ATG MO), and 58 (Adsl ATG MO + MTX) embryos. One-way ANOVA with Sidak’s multiple comparison. ns p>0.9999, ****p<0.0001. Scale bar = 100 μm. (C) Forebrains of 24 hpf zebrafish embryos (left panels) stained for acetylated tubulin (red) and Sox2-positive neural progenitors (green), anterior view. Scale bar = 200 μm. Schematic of the developing brain of zebrafish embryos adapted from Vaz et al., 2019, top-right panel. The forebrain (red) is composed of the telencephalon with the olfactory bulb (1), the pallium (2), the optic recess region (3), and the diencephalon with the hypothalamus (4). Quantification of phenotypes (bottom-right panel). Adsl morphants show fewer neural progenitor cells in the forebrain, a defect that can partially be rescued with 100 µM MTX from tailbud stage on. Data were analyzed using one-way ANOVA with Sidak’s multiple comparison. Dashes show medians. Experiments with 45 embryos (CTRL MO + DMSO), 45 embryos (CTRL MO + MTX), 45 embryos (Adsl ATG MO + DMSO), and 47 embryos (Adsl ATG MO + MTX). If not shown in the graph, all other comparisons are not significant. (D) Forebrains of 24 hr post fertilization (hpf) zebrafish embryos (left panels) stained for acetylated tubulin (red) and Sox2-positive neural progenitors (green), anterior view. Scale bar = 100 μm. Quantification of phenotypes (right panel). Adsl morphants show similar neural progenitor cells in the forebrain regardless of supplementation with 1× nucleosides. Data were analyzed using one-way ANOVA with Sidak’s multiple comparison, n.s. = p>0.9999. Dashes show medians. Experiments with 45 embryos (CTRL MO + DMSO), 45 embryos (CTRL MO + MTX), 45 embryos (Adsl ATG MO + DMSO), and 47 embryos (Adsl ATG MO + MTX).