
- Title
-
Pathway specific effects of ADSL deficiency on neurodevelopment
- Authors
- Dutto, I., Gerhards, J., Herrera, A., Souckova, O., Škopová, V., Smak, J., Junza, A., Yanes, O., Boeckx, C., Burkhalter, M.D., Zikánová, M., Pons, S., Philipp, M., Lüders, J., Stracker, T.H.
- Source
- Full text @ Elife
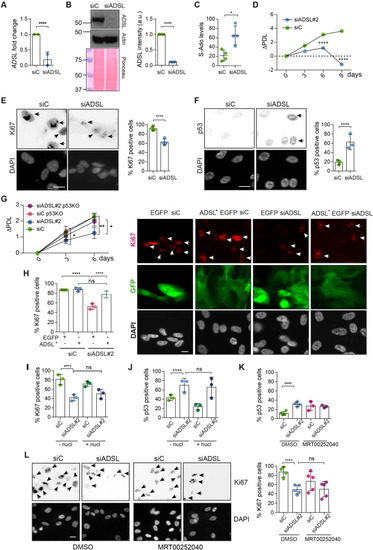
(A) Reduced mRNA levels of ADSL confirmed by qRT-PCR experiments. hTERT-RPE-1 were silenced with smart pool RNAi for 96 hr before harvesting. Two independent experiments in triplicate are shown in the panel (n = 2, two-tailed t-test, ****p<0.0001) (B) Western blot of RPE-1 cell extracts treated as in (A). One experiment is shown as representative of four independent experiments. Actin was used as a loading control. Quantifications of ADSL intensity in four different experiments were performed by ImageJ software and normalized to actin first and then to the relative controls (n = 4, two-tailed t-test, ****p<0.0001). Ponceau is shown as an additional loading and transfer control. (C) S-Ado levels in RPE-1 cells silenced with a single control or ADSL siRNA (n = 4, two-tailed t-test, *p<0.05). (D) Cell proliferation rates of RPE-1 cells quantified every 3 days after treatment with a single control or ADSL siRNA in medium with serum (n = 3, two-tailed t-test ****p<0.0001). ΔPDL represent the difference in population doubling levels quantified through the formula described in Materials and methods. (E) Ki67-positive cells (indicated by arrows) upon 96 hr of silencing with control or ADSL smart pool siRNAs. Scale bar 10 μm (n = 4, scored 767 cells for siC, 694 cells for siADSL conditions, ****p<0.0001). (F) The percentage of p53-positive cells (indicated by arrows) following treatment with control or ADSL smart pool siRNAs was quantified in three independent experiments (n = 3, scored 835 cells for siC and 1126 cells for siADSL, *p<0.05). (G) Cell proliferation rates in RPE-1 wt and p53 knockout KO cells as in (D) were counted for 6 days (n = 3, two-tailed t-test, **p<0.01, *p<0.05). (H) RPE-1 cells stably expressing EGFP or ADSL*-EGFP were transfected with a single control or ADSL siRNAs for 96 hr and immunostained with anti-Ki67 antibody. Scale bar = 20 μm. Quantification of Ki67-positive cells (n = 3, scored 278 cells for EGFP siC, 264 for EGFP siADSL, 266 for ADSL* siC, 232 cells for ADSL* siADSL conditions, ns not significant, ****p<0.0001). (I) Quantification of RPE-1 transfected with a single control or ADSL siRNA for 96 hr in the presence or absence of 60 μM nucleosides. Cells were fixed and immunostained with anti-Ki67 antibody (n = 3, at least 100 cells per conditions were counted in each experiment, ns not significant, ****p<0.0001). (J) Quantification of RPE-1 in the same conditions of (I) and immunostained with anti-p53 antibody (n = 3, at least 100 cells were counted for each condition per experiment, ns not significant, ****p<0.0001). (K) Quantification of p53-positive cells in ADSL-depleted cells in the presence or absence of the phosphoribosylaminoimidazole carboxylase (PAICS) inhibitor MRT00252040 (n = 3, scored 223 cells for siC, 248 cells for siADSL, 336 cells for siC+ MRT00252040, 365 cells for siADSL + MRT00252040, ns not significant, ****p<0.001, *p<0.05). (L) Quantification of Ki67-positive cells in ADSL-depleted cells in the presence or absence of MRT00252040 (n = 5, more than 60 cells were counted in each condition for each experiment, ns not significant, ***p<0.001). Positive cells are indicated with arrows in siADSL panels. All graphs depict means ± SD with individual values shown in circles.
|
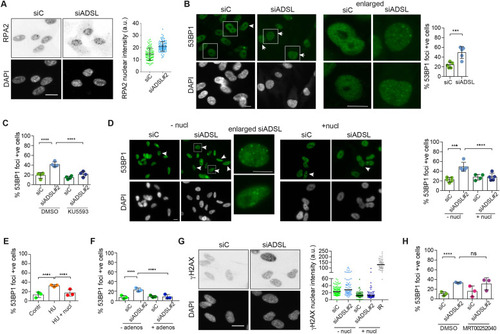
(A) RPE-1 were silenced for 96 hr with a smart pool of ADSL siRNAs, chromatin extracted, and immunostained with an anti-RPA2 antibody. Nuclear intensity of cells was measured- Quantification of one representative experiment of four that showed similar results is shown; SD and average are indicated in black. After normalization to the average of the control (siC), two-tailed t-test was used for statistical analysis of n = 4 independent experiments: *p<0.05 was observed for siADSL to siC. (B) RPE-1 were silenced for 96 hr with a smart pool of ADSL siRNAs, fixed, and immunostained with anti-53BP1 antibody. Scale bar = 10 μm. Quantification of positive cells that have more than five foci per cell (n = 5 scored 1134 cells for siC, 1144 cells for siADSL, ***p<0.001). (C) RPE-1 were silenced with a single control or ADSL siRNA with or without 5 mM ATM inhibitor (KU5593) (n = 4, scored 359 cells for siC, 322 cells for siADSL, 307 cells for siC + KU5593, 279 cells for siADSL + KU5593, ****p<0.0001). (D) Cells were silenced for 96 hr, treated or not with 60 μM (1×) nucleosides, and stained for 53BP1. Scale bar = 10 μm (n = 5, scored 717 cells for siC, 608 cells for siADSL, 576 cells for siC + nucl, 512 cells for siADSL + nucl, ****p<0.0001). (E) RPE-1 cells were treated with 2 mM hydroxyurea (HU) for 6 hr and treated or not with 1× nucleosides and stained for 53BP1. Cells with more than five foci per nucleus were counted as positive. Three independent experiments were performed (n = 3, at least 100 cells per experiment per condition were counted, ****p<0.0001). (F) Cells were silenced for 96 hr, treated or not with 80 μg/ml adenosine, and stained for 53BP1 (n = 3, scored 544 cells for siC, 428 cells for siADSL, 485 cells for siC+ adenosine, 411 cells for siADSL + adenosine, ****p<0.0001). (G) RPE-1 treated as in (A) were fixed and stained for γH2AX (H2AX phosphorylated on Ser-139). Scale bar = 10 μm. 5 Gy X-ray irradiation (IR) was used as positive control. Quantification of one representative experiment of two that showed similar results is shown; median is indicated in black. After normalization to the average of the control (siC), one-tailed t-test was used for statistical analysis of n = 3 independent experiments: *p<0.05 was observed for siADSL (to siC), and for siADSL relative to siADSL + nucl. There is no statistical difference between siC and siC + nucl. (H) RPE-1 were silenced in the presence or absence of 4 μM MRT00252040, fixed and stained for 53BP1 (n = 4, scored 367 cells for siC, 313 cells for siADSL, 294 cells for siC + MRT00252040, 241 cells for siADSL + MRT00252040, ns not significant, ****p<0.0001). All bar graphs show means ± SD with individual values in circles.
|
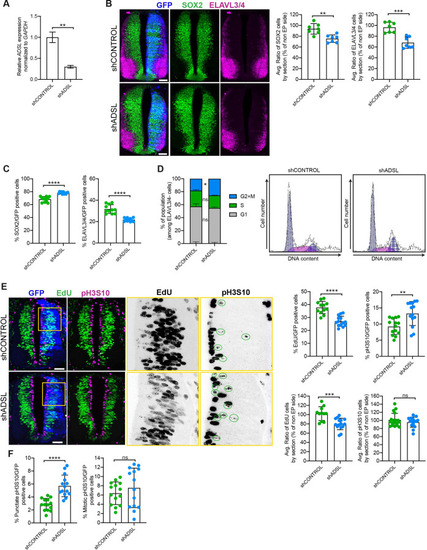
(A) mRNA levels of ADSL and GAPDH were measured by qRT-PCR in chicken embryonic fibroblasts (CEFs) transfected for 24 hr with shCONTROL or shADSL to confirm knockdown efficiency (n = 3, two-tailed t-test, **p<0.01). (B) Transverse sections of HH12 chicken neural tubes 48 hr post electroporation (hpe) with shCONTROL or shADSL plasmids and stained with antibodies against SOX2 (green) and ELAVL3/4 (magenta). Transfection was detected by GFP (blue). Scale bar = 50 μm. Average ratio of neural stem cells (NSCs, SOX2+) 48 hpe with shCONTROL or shADSL obtained by comparing the mean number of SOX2+ cells on the electroporated and non-electroporated side (n = 7 embryos, two-tailed t-test, **p<0.01). Average ratio of cells differentiated into neurons (ELAVL3/4) at 48 hpe with shCONTROL or shADSL obtained by comparing the mean number of ELAVL3/4-positive cells on the electroporated and the non-electroporated side (n = 7 embryos, two-tailed t-test, ***p<0.001). (C) Percentage of electroporated cells identified as NSCs (SOX2) or neurons (ELAVL3/4) 48 hpe with shCONTROL or shADSL (n = 11 embryos, two-tailed t-test, ****p<0.0001). (D) The cell cycle profiles of NSCs (GFP+/ELAVL3/4-) obtained by fluorescence-associated cell sorting (FACS) 48 hpe with shCONTROL or shADSL into HH12 chicken neural tubes. The mean of two independent experiments is shown in the left panel. 6–8 embryos per condition were used for each experiment. Two-tailed t-test was used for statistical analysis of n = 2 independent experiments, ns not significant, *p<0.05. Cell cycle profiles of a representative experiment are shown in the right panels. (E) Transverse sections of HH12 chicken neural tubes 48 hpe with shCONTROL or shADSL plasmids, and stained with EdU (green) and an antibody against pH3S10 (magenta). Transfection was detected by GFP (blue). Scale bar = 50 μm. Areas indicated in yellow are amplified in the right panels showing separated channels in black. Green circles in pH3S10 amplification show punctate pH3S10-positive cells. Percentage of transfected cells identified as EdU-positive 48 hpe with shCONTROL or shADSL (n = 12 embryos [shCONTROL] and 14 embryos [shADSL], two-tailed t-test, ****p<0.0001). Percentage of pH3S10 among the GFP+ cell population 48 hpe with shCONTROL or shADSL (n = 14 embryos, two-tailed t-test, ns not significant, **p<0.01, ****p<0.0001). Average ratio of EdU and pH3S10-positive cells 48 hpe of shCONTROL or shADSL plasmids, obtained by comparing the mean number of EdU cells on the electroporated and the non-electroporated side (EdU: n = 11 embryos [shCONTROL], 15 embryos [shADSL], two-tailed t-test, ***p<0.001; pH3S10: n = 18 embryos [shCONTROL], 15 embryos [shADSL], two-tailed t-test, ns not significant). (F) Percentage of punctate pH3S10 (G2 phase) and mitotic pH3S10 (M phase) among the GFP+ cell population 48 hpe of shCONTROL or shADSL plasmids (n = 14 embryos, two-tailed t-test, ns not significant, ****p<0.0001). Bar graphs show means ± SD.
|
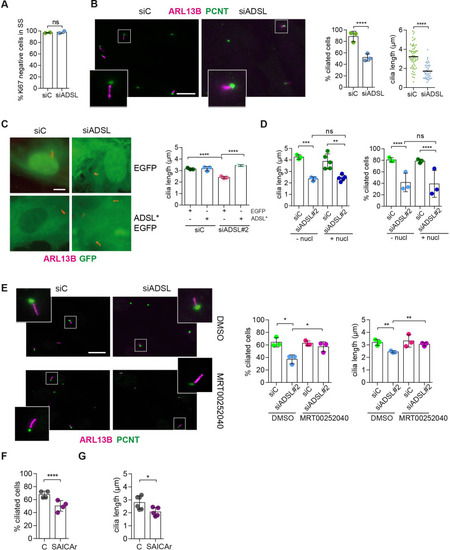
(A) RPE-1 were transfected with control or ADSL smart pool siRNAs. After 96 hr, cells were serum starved for 48 hr to induce ciliogenesis followed by staining against Ki67 and negative cells quantified (n = 2, two-tailed t-test, ns not significant). (B) Ciliated cells silenced as in (A) were stained for ARL13B (magenta) and pericentrin (PCNT) (green). Scale bar = 10 μm. Magenta squares show enlargements of the areas. Graphs show quantification of ciliated cells and cilia length (line indicates median) (n = 3, scored 108 cells for siC, 82 cells for siADSL, ****p<0.0001). (C) RPE1 cells stably expressing EGFP or ADSL*-EGFP were silenced for 96 hr with control or a single ADSL siRNA, serum starved for 48 hr, fixed, and stained for ARL13B (red). Scale bar = 5 μm. Graphs summarize three experiments (one-way ANOVA, ns not significant, ***p<0.001, **p<0.01, *p<0.05). (D) RPE-1 cells silenced with a single ADSL siRNA (siADSL#2) for 96 hr in the absence or presence of 1× nucleosides. Cilia frequency and cilia length were quantified; mean ± SD of n = 3 siC (scored 557 cells) and siADSL (scored 499 cells), n = 5 for siC (588 cells) and siADSL (scored 297 cells) with nucleosides, ns not significant, ***p<0.001. (E) RPE-1 cells were ADSL-depleted, treated or not with MRT00252040 and serum starved, and then immunostained for ARL13B (magenta) and PCNT (green). Cilia frequency and cilia length were quantified (n = 3, scored 261 cells for siC, 166 cells for siADSL, 287 cells for siC + MRT0025204, 170 cells for siADSL + MRT00252040, **p<0.01, ****p<0.0001). Scale bar = 10 μm. (F) Quantification of the cilia frequency in control and SAICAR-treated cells (n = 4, scored 589 cells for control, 456 cells for SAICAR-treated, ****p<0.0001). (G) Cilia length measurement of cells treated as in (F) (n = 5, two-tailed t-test, *p<0.05).
|
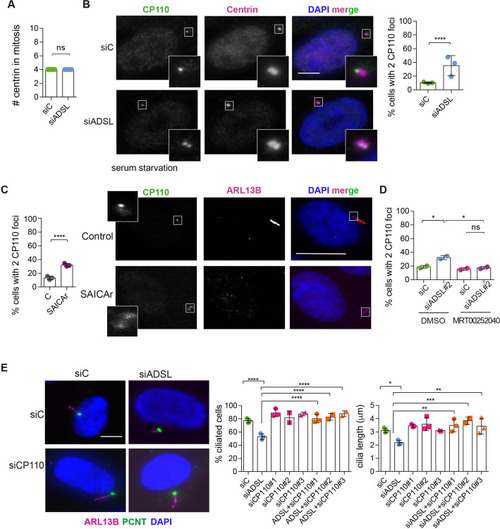
(A) Quantification of the number of centrin foci present in mitotic RPE-1 cells transfected with control or ADSL smart pool siRNAs for 96 hr (n = 2, two-tailed t-test, ns not significant). (B) ADSL-silenced cells and controls were stained for centrin (magenta) and CP110 (green). Nuclei are shown by DAPI (blue). Graph depicts the number of ciliated cells with two CP110 foci per centrosome (n = 3, scored 342 cells for siC, 221 cells for siADSL, *p<0.05). (C) Cells mock or treated with SAICAr were processed and analyzed as described in panel (B) (n = 3, scored 288 cells for control and 253 cells for SAICAr, ***p<0.001). (D) RPE-1 cells depleted with ADSL or control siRNAs were treated with vehicle or MRT00252040 and stained as in (B, C). Graph depicts the percentage of cells presenting two CP110 foci per centrosome (n = 2; scored 177 cells for siC + DMSO, 180 cells for siADSL + DMSO, 75 cells for siC + MRT00252040, 78 cells for siADSL + MRT00252040, *p<0.05). (E) RPE-1 cells depleted with ADSL and/or CP110 (silenced for 24 hr with three different siRNAs) were serum starved for 48 hr, fixed, and stained for ARL13B (magenta) and pericentrin (PCNT) (green). Graphs show the number of ciliated cells (n = 3 for siC, siADSL, siCP110#1, siADSL + siCP110#1; n = 2 for siCP110#2, siCP110#3, siADSL + siCP110#2 and siADSL + siCP110#3, scored 461 cells for siC, 301 cells for siADSL, 277 cells for siCP110#1, 289 cells for siADSL + siCP110#1, 119 cells for siCP110#2, 90 cells for siADSL + siCP110#2, 141 cells for siCP110#3, 98 cells for siADSL + siCP110#3, ****p<0.0001, ***p<0.001) and cilia length (n = 3, one-way ANOVA ***p<0.001, **p<0.01, *p<0.05). All graphs show means ± SD with individual values shown in circles.
|
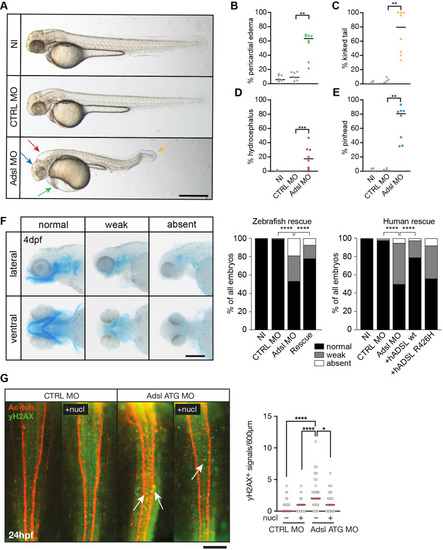
(A) Live images of 48 hr post fertilization (hpf) zebrafish embryos showing pericardial edema (green arrow), kinked tail (yellow arrow), hydrocephalus (red arrow), and pinhead (blue arrow). NI (uninjected controls), CTRL MO (embryos injected with a standard control MO), Adsl ATG MO (injected with a translation blocking MO against Adsl). Scale bar = 500 μm. (B–E) Quantification of the percentage of embryos developing the indicated phenotypes. For (B–E), each circle indicates one experiment. Data from eight experiments with 311 embryos (NI), 275 (CTRL MO), and 227 (Adsl ATG MO) is shown. Kruskal–Wallis test with Dunn’s multiple comparison. Dashes show median. **p=0.0042 (pericardial edema), **p=0.0032 (kinked tail), **p=0.0011 (pinhead), ***p=0.0005 (hydrocephalus). (F) Adsl-depleted zebrafish display skull formation defects. Cartilage staining of zebrafish embryos (4 days post fertilization [dpf]) with Alcian Blue. Embryos were classified according to the severity of their phenotype in normal staining, weak staining, or absent cartilage. Lateral and ventral view. Cartilage formation could be rescued by co-injection of capped mRNA encoding zebrafish Adsl. 6–8 experiments with a total of 178 embryos (NI), 133 (CTRL MO), 169 (Adsl ATG MO), and 123 (Rescue). Injection of mRNA encoding human wt ADSL, but not the R426H ADSLD variant, restores cartilage formation in embryos. Four experiments with a total of 116 embryos (NI), 81 (CTRL MO), 80 (Adsl ATG MO), 91 (+ hADSL wt), and 89 (+ hADSL R426H). Two-tailed Fisher’s exact test; ****p<0.0001. Scale bar = 200 μm. (G) Immunofluorescence staining of the neural tube (dorsal view) of control and Adsl-depleted embryos 24 hpf for γH2AX (green) and acetylated-tubulin (Ac-tub: red). Treatment with 60 mM nucleosides was carried out in indicated samples. Experiments with 45 embryos per treatment are shown, dashes indicate median. Data were analyzed by using Kruskal–Wallis test with Dunn’s correction. *p<0.05, ****p<0.0001. Scale bar = 300 μm. Unless indicated, comparisons are not significant.
|
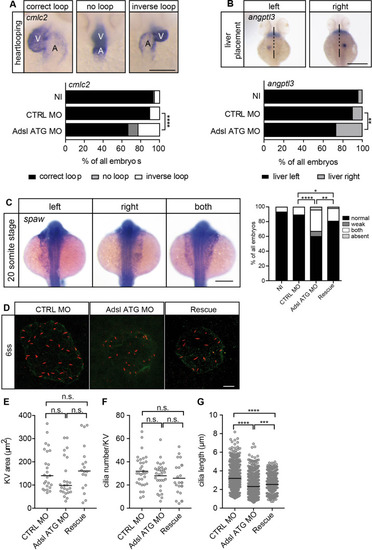
(A) At 48 hr post fertilization (hpf), the ventricle (V) of the two-chambered zebrafish heart is placed left and above the atrium (A). Adsl-depleted embryos more frequently develop inversely looped hearts or developed unlooped hearts (no loop) (as scored by whole-mount in situ hybridization for cardiac myosin light chain 2 [cmlc2]). N = 6 experiments with a total of 266 embryos (NI), 176 embryos (CTRL MO), and 188 embryos (Adsl ATG MO). Scale bar = 100 μm. (B) Whole-mount in situ hybridization for angiopoietin-like 3 (angptl3) to assess liver placement in 48 hpf embryos. Dorsal view. Scale bar = 200 μm. 185 NI, 121 CTRL MO, and 99 Adsl ATG MO embryos. (A, B) Two-tailed Fisher’s exact test; **p<0.0015, ****p<0.0001. (C) Whole-mount in situ hybridization for the left lateral plate mesoderm marker southpaw (spaw) at 20 somite stage (ss). Spaw is normally expressed in the left lateral plate mesoderm. When LR asymmetry is disturbed, spaw can be detected on the right side or on both sides. Aberrant expression of spaw in Adsl morphants. Co-injection of RNA encoding zebrafish Adsl restores proper spaw expression. Two-tailed Fisher’s exact test; *p=0.0451, **p=0.0016, ****p<0.0001. Results from five experiments with 121 embryos (NI), 142 (CTRL MO), 128 (Adsl ATG MO), and 105 (Rescue) are shown. Scale bar = 200 μm. (D) Confocal z-stacks of the Kupffer’s vesicle (KV) of six ss embryos. Cilia are stained red (acetylated tubulin), while apical cell borders were stained for PKCζ (green). Scale bar = 10 μm. (E) No significant changes in the size of the KV upon Adsl depletion. n = 25 (CTRL MO), 25 (Adsl ATG MO), and 18 embryos (rescue with zebrafish adsl RNA). Each circle is one embryo, line indicates median. Kruskal–Wallis test with Dunn’s correction. p-values: CTRL MO vs. Adsl ATG MO: 0.2582; CTRL MO vs. Rescue: >0.9999; Adsl ATG MO vs. Rescue: 0.1684. (F) No significant changes in the number of cilia per KV. n = 32 (CTRL MO), 30 (Adsl ATG MO), and 20 embryos (rescue with zebrafish adsl RNA). Each circle is one embryo, lines show means. One-way ANOVA with Sidak’s multiple comparison test. p=0.5538 (CTRL MO vs. Adsl ATG MO), 0.2844 (CTRL MO vs. Rescue), and 0.9225 (Adsl ATG MO vs. Rescue). (G) Shorter cilia in Adsl morphants can be partially elongated by co-injection of RNA encoding zebrafish Adsl. n = 960 cilia (CTRL MO), 798 (Adsl ATG MO), and 540 (Rescue). Kruskal–Wallis test with Dunn’s correction, lines indicate medians; ***p=0.0008.
|
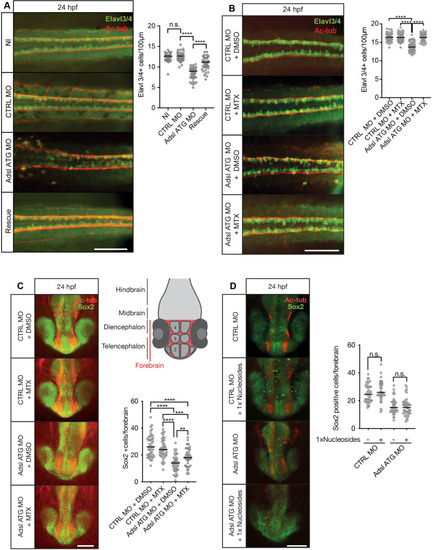
(A) Immunofluorescence whole-mount microscopy of neural tubes of 24 hr post fertilization (hpf) zebrafish embryos (dorsal view) stained for acetylated tubulin (axons, red) and Elavl3/4 (green). Fewer Elavl3/4-positive cells in Adsl-depleted embryos that can be rescued by co-injection with RNA encoding zebrafish Adsl (Rescue). Graph shows Elavl3/4 counts of individual embryos, line indicates median. Three experiments with 45 embryos (NI), 45 (CTRL MO), 45 (Adsl ATG MO), and 45 (Rescue). Kruskal–Wallis test with Dunn’s correction. ns, not significant. p>0.9999, ****p<0.0001. Scale bar = 100 μm. (B) MTX treatment rescues Elavl3/4-positive cell numbers. Staining of the neural tube (dorsal view) of 24 hpf zebrafish embryos for acetylated tubulin (red) and or Elavl3/4 (green). Adsl morphants show fewer Elavl3/4-positive cells, which could be rescued by treatment with 100 µM MTX. Five experiments with 69 (CTRL MO), 75 (CTRL MO + MTX), 63 (Adsl ATG MO), and 58 (Adsl ATG MO + MTX) embryos. One-way ANOVA with Sidak’s multiple comparison. ns p>0.9999, ****p<0.0001. Scale bar = 100 μm. (C) Forebrains of 24 hpf zebrafish embryos (left panels) stained for acetylated tubulin (red) and Sox2-positive neural progenitors (green), anterior view. Scale bar = 200 μm. Schematic of the developing brain of zebrafish embryos adapted from Vaz et al., 2019, top-right panel. The forebrain (red) is composed of the telencephalon with the olfactory bulb (1), the pallium (2), the optic recess region (3), and the diencephalon with the hypothalamus (4). Quantification of phenotypes (bottom-right panel). Adsl morphants show fewer neural progenitor cells in the forebrain, a defect that can partially be rescued with 100 µM MTX from tailbud stage on. Data were analyzed using one-way ANOVA with Sidak’s multiple comparison. Dashes show medians. Experiments with 45 embryos (CTRL MO + DMSO), 45 embryos (CTRL MO + MTX), 45 embryos (Adsl ATG MO + DMSO), and 47 embryos (Adsl ATG MO + MTX). If not shown in the graph, all other comparisons are not significant. (D) Forebrains of 24 hr post fertilization (hpf) zebrafish embryos (left panels) stained for acetylated tubulin (red) and Sox2-positive neural progenitors (green), anterior view. Scale bar = 100 μm. Quantification of phenotypes (right panel). Adsl morphants show similar neural progenitor cells in the forebrain regardless of supplementation with 1× nucleosides. Data were analyzed using one-way ANOVA with Sidak’s multiple comparison, n.s. = p>0.9999. Dashes show medians. Experiments with 45 embryos (CTRL MO + DMSO), 45 embryos (CTRL MO + MTX), 45 embryos (Adsl ATG MO + DMSO), and 47 embryos (Adsl ATG MO + MTX).
|