
FIGURE 7
- ID
- ZDB-FIG-211111-31
- Publication
- Mayeur et al., 2021 - When Bigger Is Better: 3D RNA Profiling of the Developing Head in the Catshark Scyliorhinus canicula
- Other Figures
- All Figure Page
- Back to All Figure Page
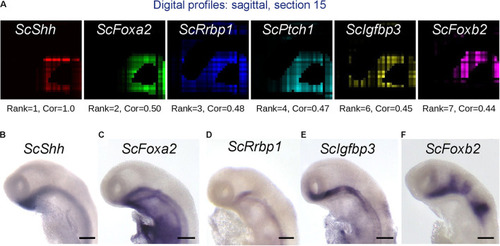
Figure 7. Identification of genes harboring expression correlation with ScShh. (A) Digital profiles on sagittal section number 15 (out of 30, from left to right) of a selection of genes showing a high expression correlation to ScShh (red), ScFoxA2 (green), ScRrbp1 (blue), ScPtch1 (cyan), ScIgfbp3 (yellow), and ScFoxb2 (purple). The rank of each gene in the list of gene models ordered by decreasing correlation to ScShh and the correlation value (Cor) are indicated below each section. (B–F) Left lateral views of stage 17 catshark embryonic heads after ISH using probes for ScShh (B), ScFoxA2 (C), ScRrbp1 (D), ScIgfbp3 (E), and ScFoxb2 (F). Scale bars = 200 μm. |