FIGURE

FIGURE 1

ID
ZDB-FIG-211111-26
Publication
Mayeur et al., 2021 - When Bigger Is Better: 3D RNA Profiling of the Developing Head in the Catshark Scyliorhinus canicula
Other Figures
All Figure Page
Back to All Figure Page
FIGURE 1

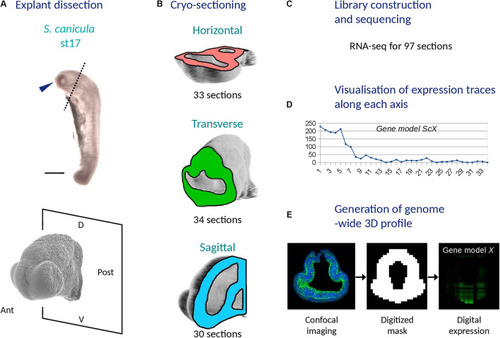
Main experimental steps used to generate a 3D RNA profile of the catshark embryonic head (stage 17). (A) Explant dissection: the top panel shows a left side photograph of a stage 17 catshark embryo with a blue arrowhead showing the dissected explant and a dotted line delimiting its posterior boundary and the bottom panel shows a higher magnification confocal view of the explant with the posterior dissection plane. (B) Cryo-sectioning: schemes show the planes used to generate series of cryo-sections (horizontal, pink; transverse, green; sagittal, blue). The total number of sections along each plane is indicated. (C) Library construction and sequencing resulting in RNA-seq data for a total of 97 sections. (D) Visualization of expression traces along each axis for all gene models. (E) Generation of a genome-wide 3D profile with its three steps (acquisition of a confocal 3D image of the explant, generation of a digitized model and computation of digital expressions for each voxel and gene model). D, dorsal; V, ventral; Ant, anterior; Post, posterior.

Expression Data

Expression Detail
Antibody Labeling
Phenotype Data

Phenotype Detail
Acknowledgments
This image is the copyrighted work of the attributed author or publisher, and ZFIN has permission only to display this image to its users. Additional permissions should be obtained from the applicable author or publisher of the image. Full text @ Front Cell Dev Biol