
FIGURE
FIGURE 2
- ID
- ZDB-FIG-211111-27
- Publication
- Mayeur et al., 2021 - When Bigger Is Better: 3D RNA Profiling of the Developing Head in the Catshark Scyliorhinus canicula
- Other Figures
- All Figure Page
- Back to All Figure Page
FIGURE 2
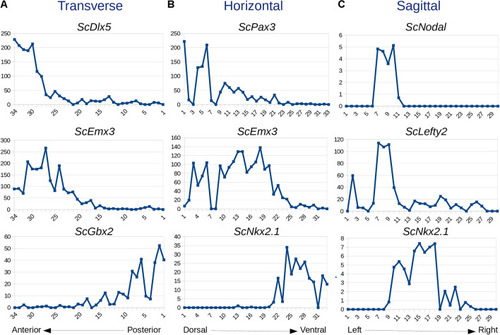
Expression traces for selected genes along transverse |
Expression Data
Expression Detail
Antibody Labeling
Phenotype Data
Phenotype Detail
Acknowledgments
This image is the copyrighted work of the attributed author or publisher, and
ZFIN has permission only to display this image to its users.
Additional permissions should be obtained from the applicable author or publisher of the image.
Full text @ Front Cell Dev Biol