
FIGURE 5
- ID
- ZDB-FIG-211111-23
- Publication
- Mayeur et al., 2021 - When Bigger Is Better: 3D RNA Profiling of the Developing Head in the Catshark Scyliorhinus canicula
- Other Figures
- All Figure Page
- Back to All Figure Page
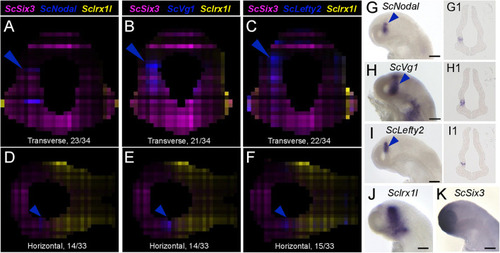
Figure 5. Nodal signaling components exhibit left enriched profiles. (A–F) Digital transverse (A–C) and horizontal (D–F) sections showing merged profiles of ScSix3 (magenta), ScIrx1l (yellow), and in blue ScNodal (A,D), ScVg1 (B,E), ScLefty2 (C,F). Sections are numbered from posterior to anterior in panels (A–C) and from dorsal to ventral in panels (D–F). (G–K) Left lateral views of stage 17 catshark embryonic heads after whole-mount ISH with probes for ScNodal (G), ScVg1 (H), ScLefty2 (I), ScIrx1l (J), and ScSix3 (K). (G1–I1) Horizontal sections of the brain of stage 17 catshark embryos after hybridization with probes for ScNodal (G1), ScVg1 (H1), ScLefty2 (I1). Blue arrowheads point to ScNodal, ScVg1, and ScLefty2 left-restricted digital or ISH signals in the dorsal diencephalon. Scale bars = 200 μm. |